
Reporting
Financial reports computed from your data, and scheduled runs.
Reporting turns the master data connected under Basedata into the metrics a buyer actually asks about — MRR, ARR, ARPU, Rule of 40, EBITDA, and more — without anyone building a spreadsheet by hand.
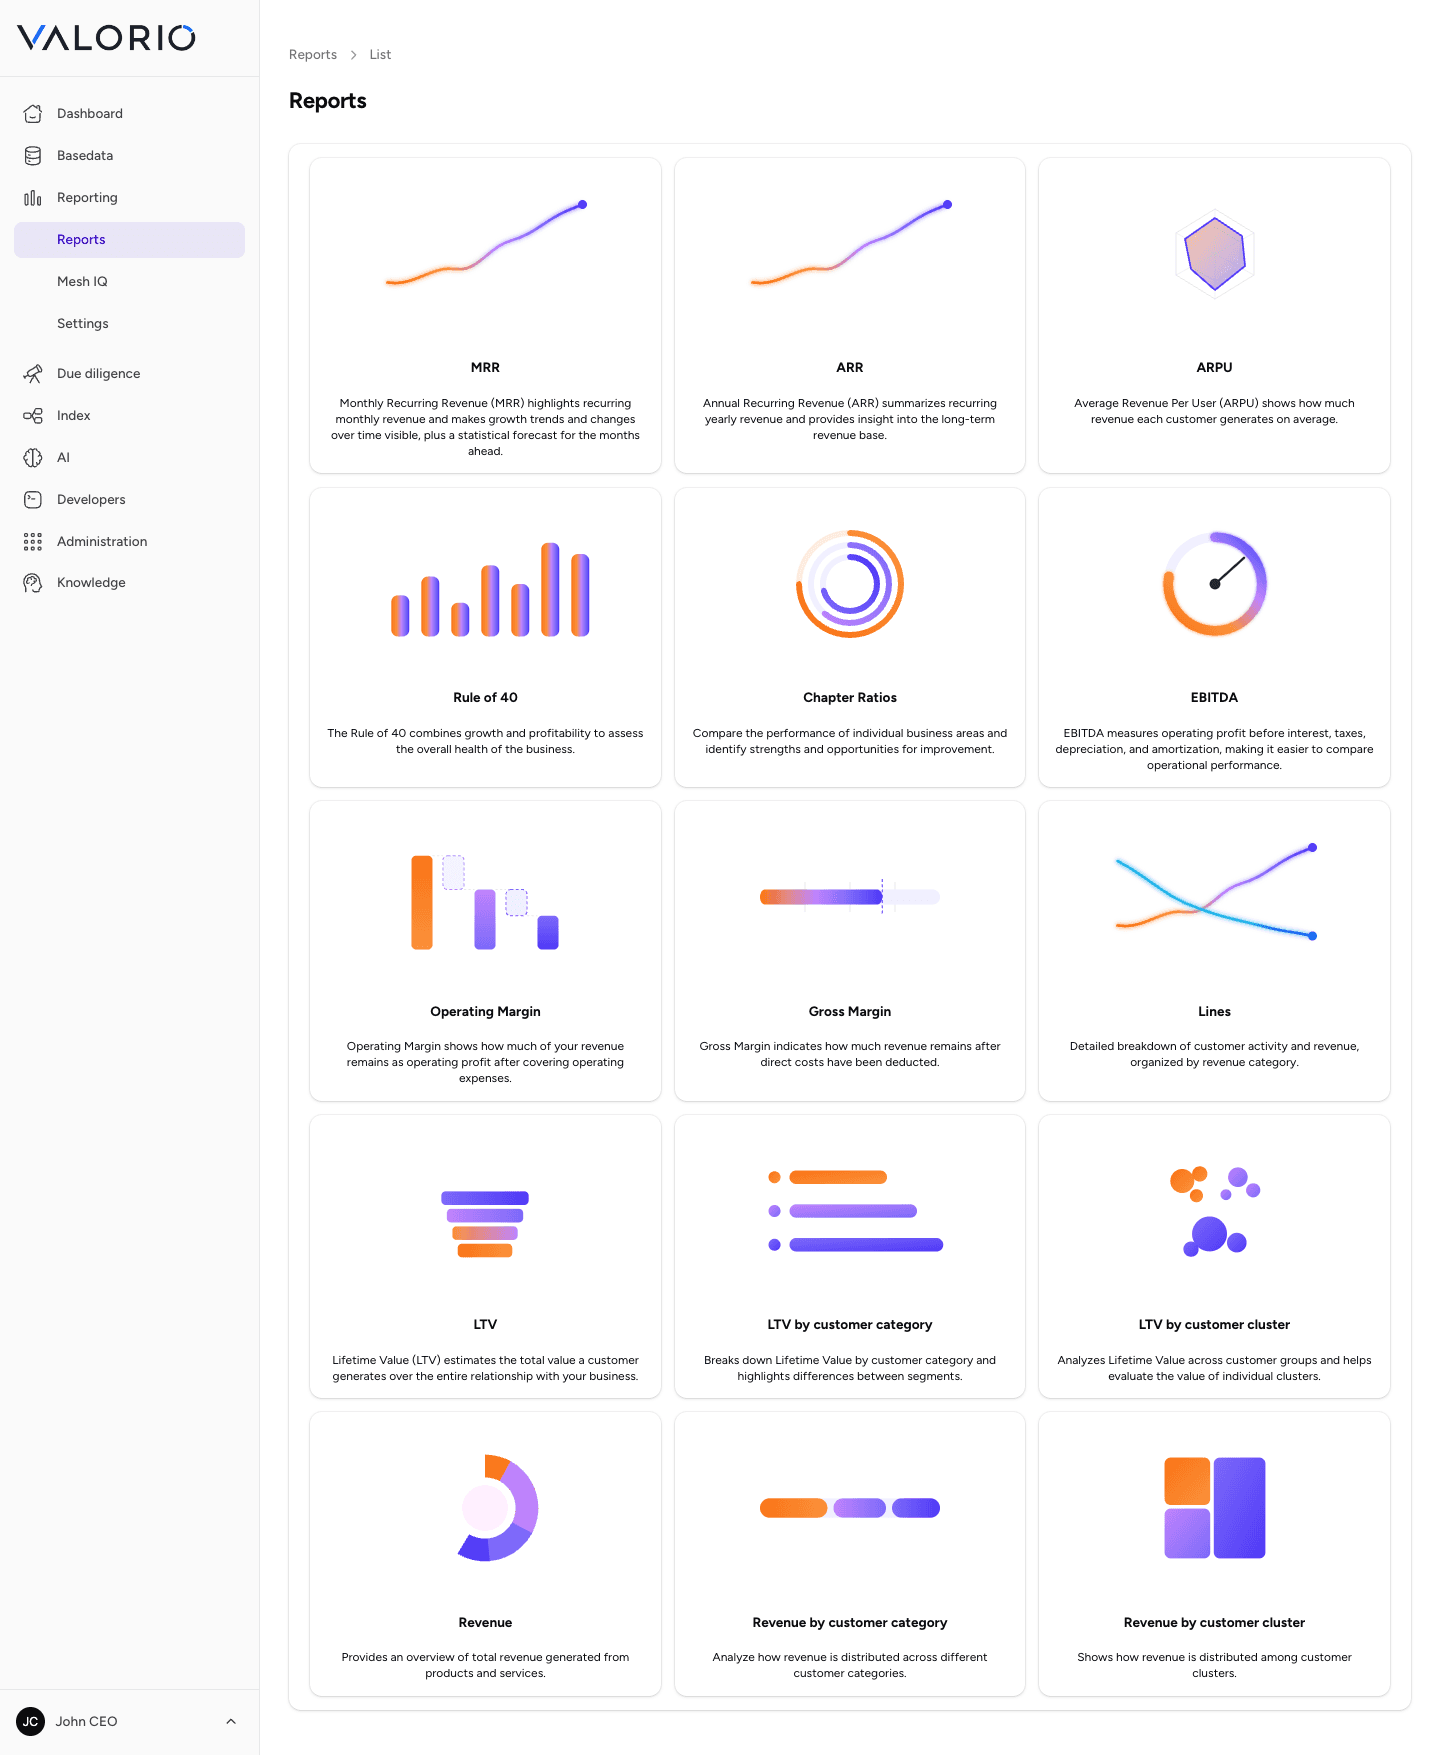
Reports
Each report is a self-contained view of one metric or metric family, computed live from the underlying earnings and expenses records. Because a report's numbers are computed rather than typed in, they stay consistent with whatever the data sources most recently produced — there's no risk of an out-of-date copy circulating.
Reports are the input to two other modules: an analysis run reads them looking for findings worth flagging, and Mesh IQ reasons across several of them at once to answer a question no single report covers.
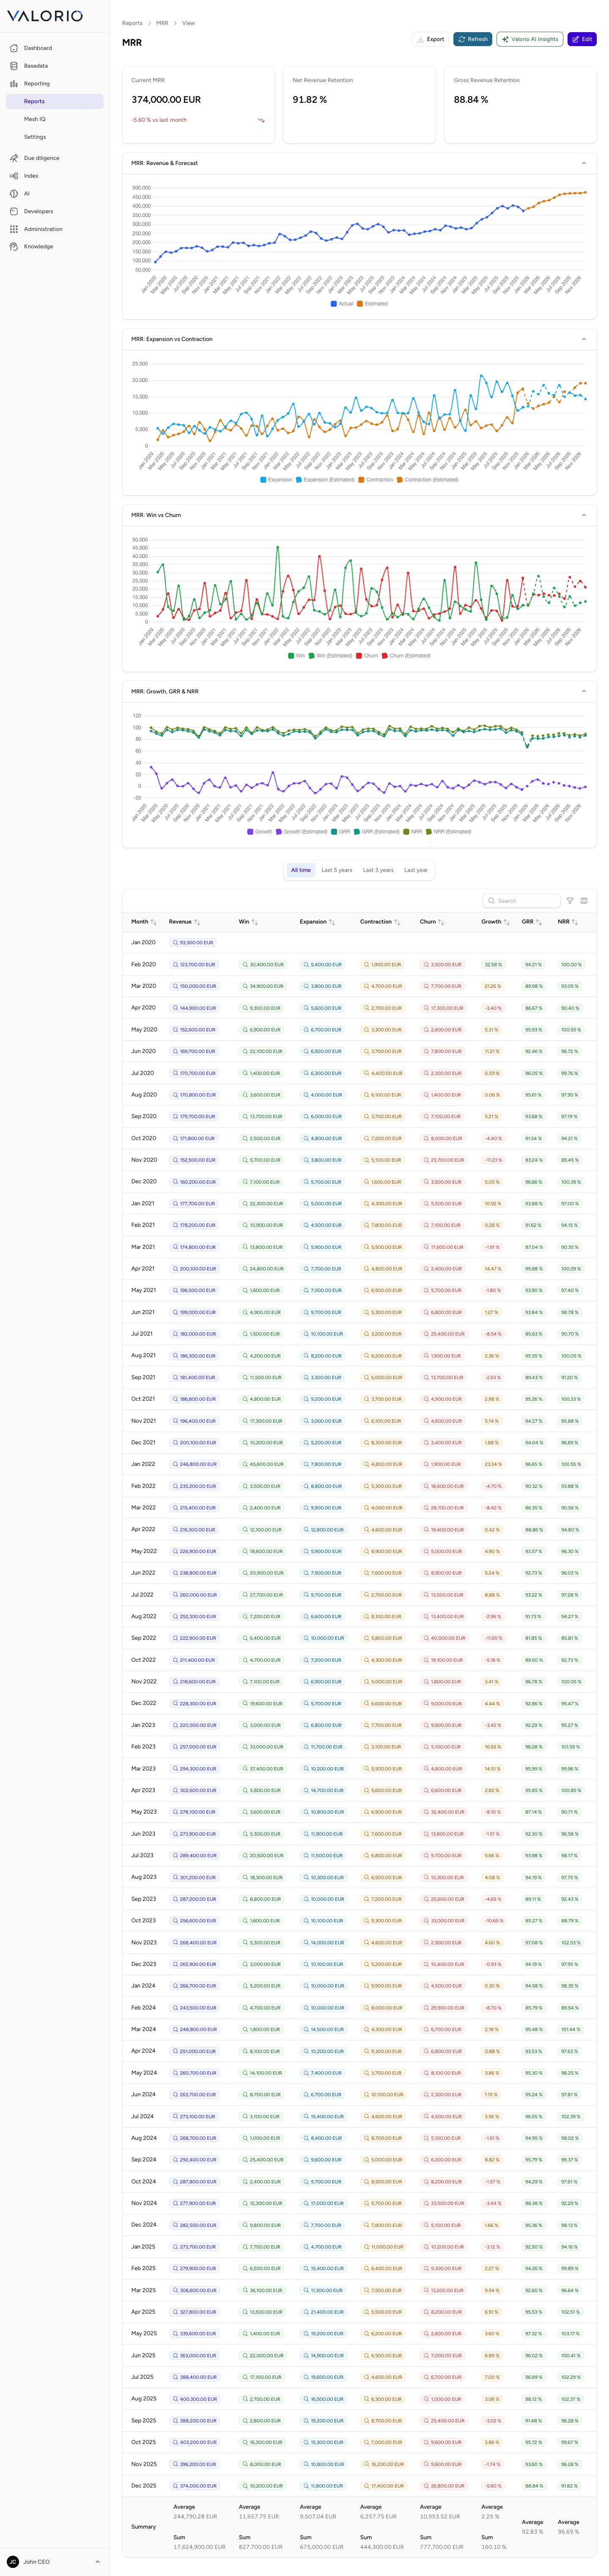
MRR
Monthly Recurring Revenue (MRR) highlights recurring monthly revenue and makes growth trends and changes over time visible, plus a statistical forecast for the months ahead.
It's usually the first number a buyer asks for — the health of the recurring base, independent of one-off revenue, is what most SaaS valuations are actually built on.
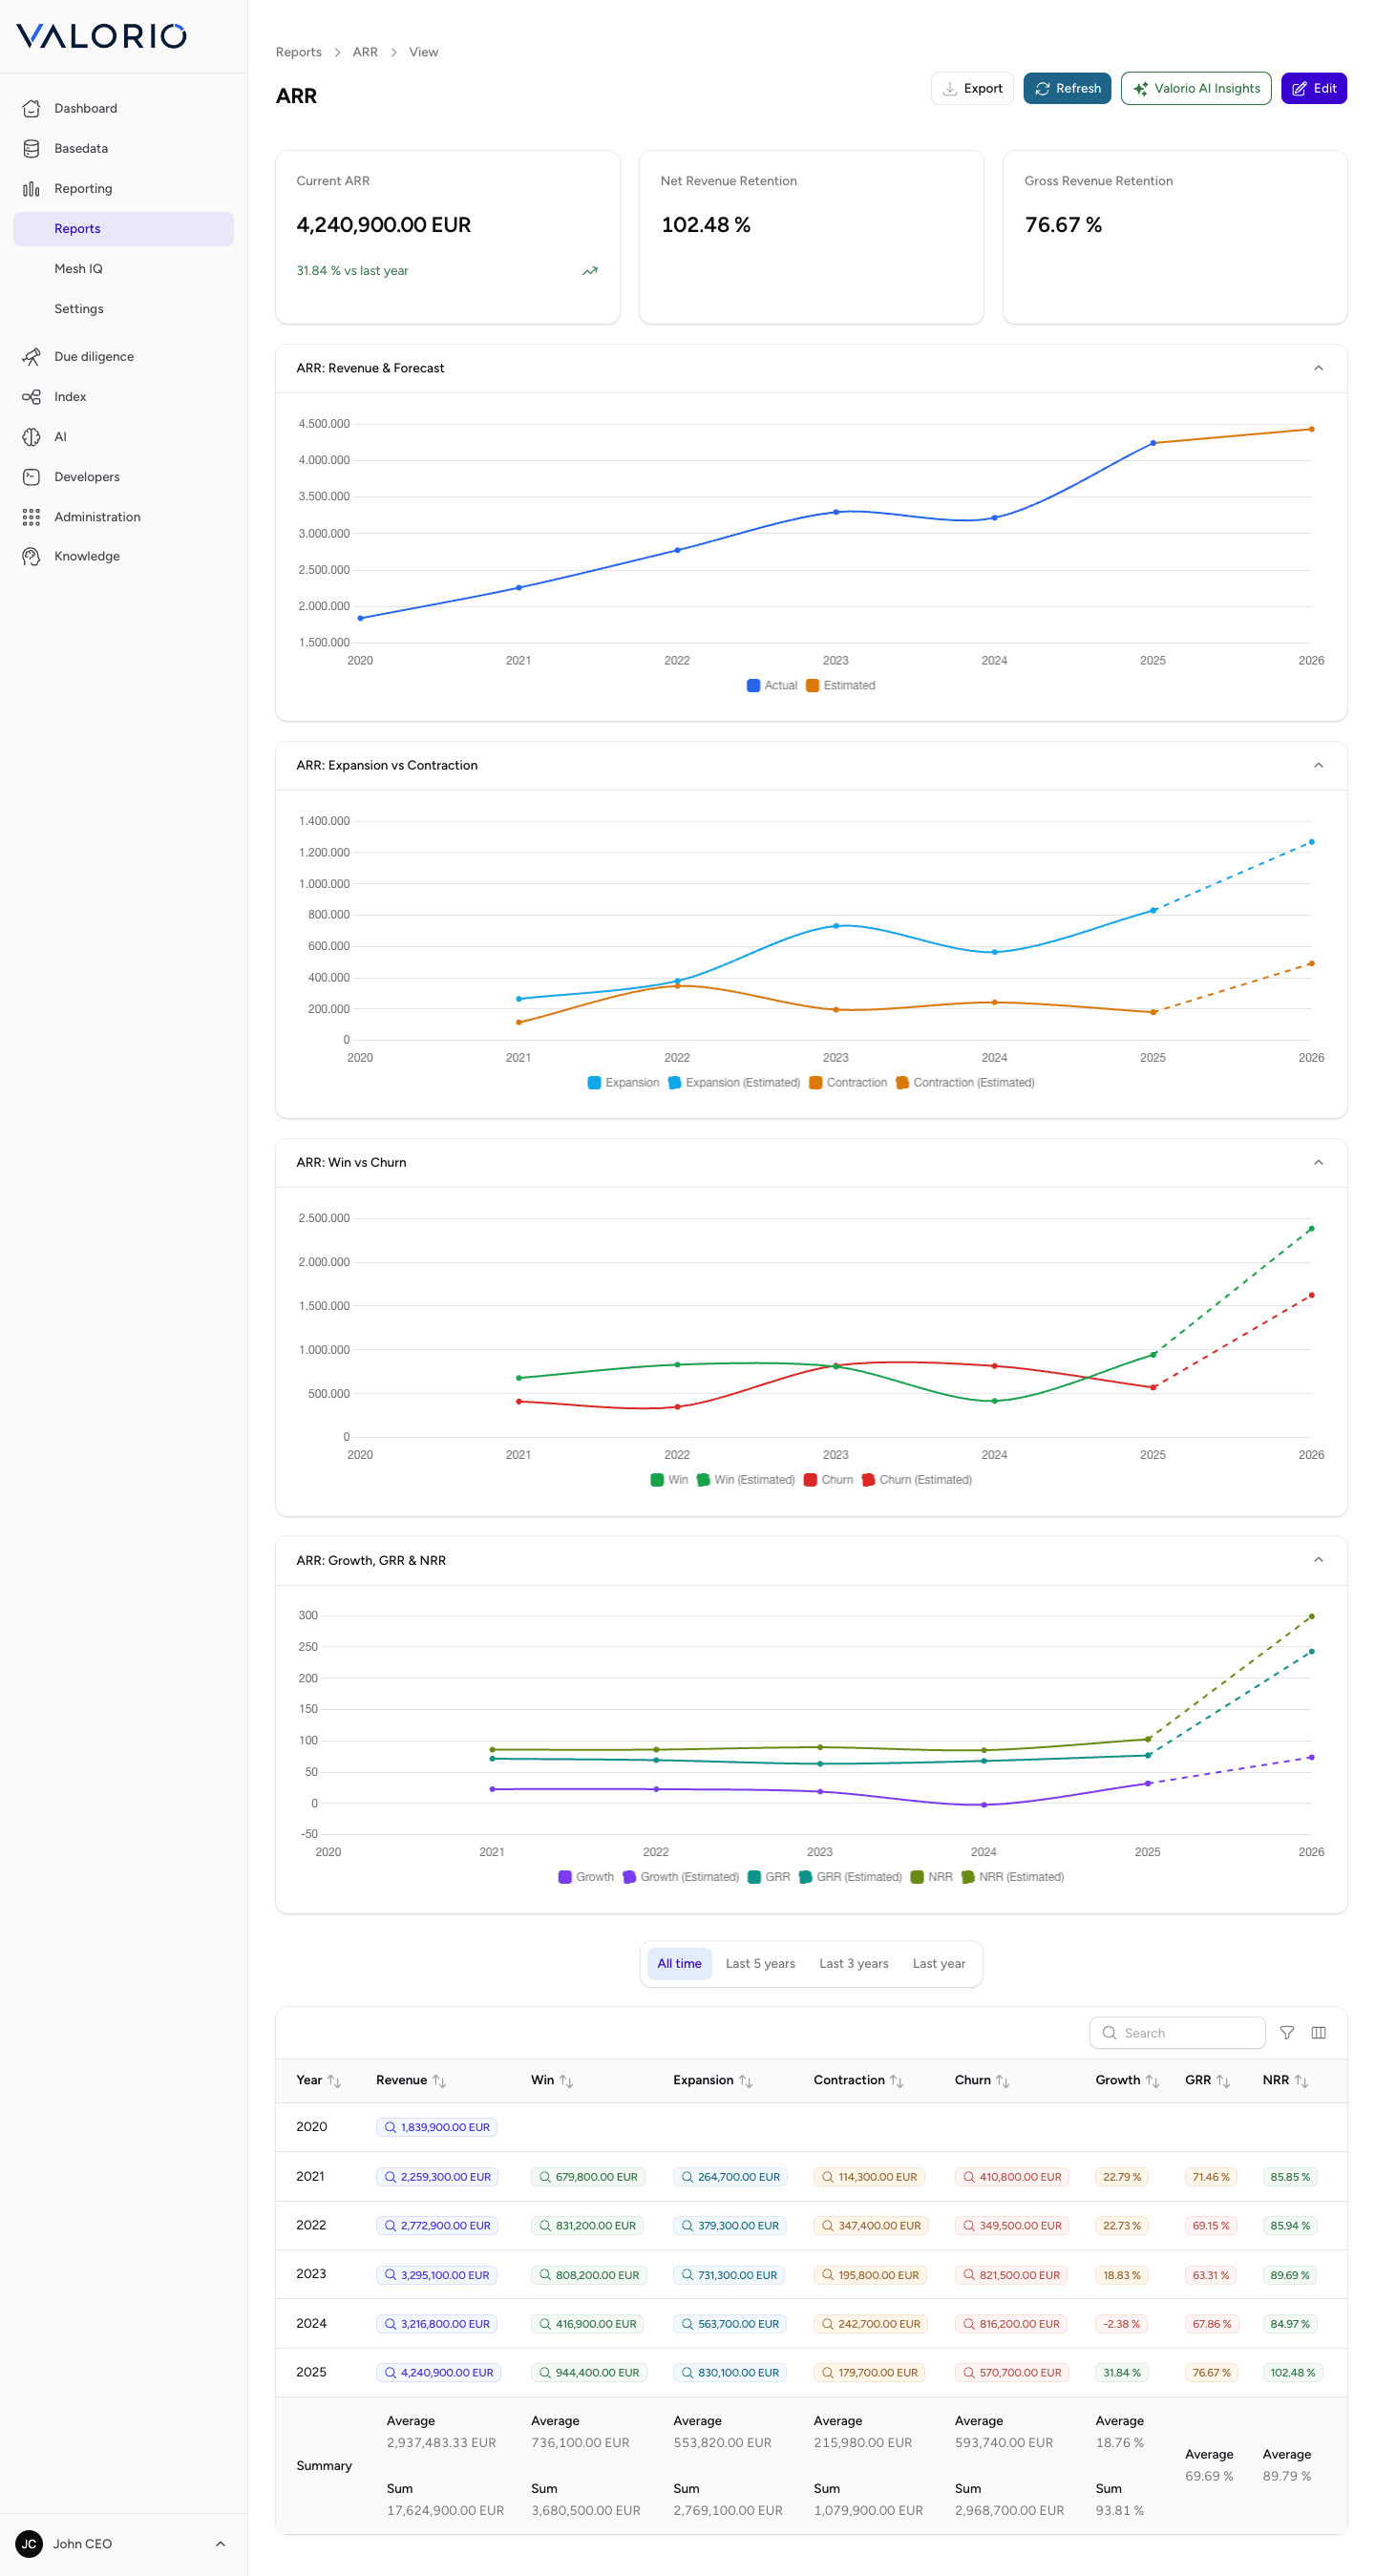
ARR
Annual Recurring Revenue (ARR) summarizes recurring yearly revenue and provides insight into the long-term revenue base.
It's the headline figure in most term sheets — ARR multiples are the most common shorthand buyers use to size an offer.
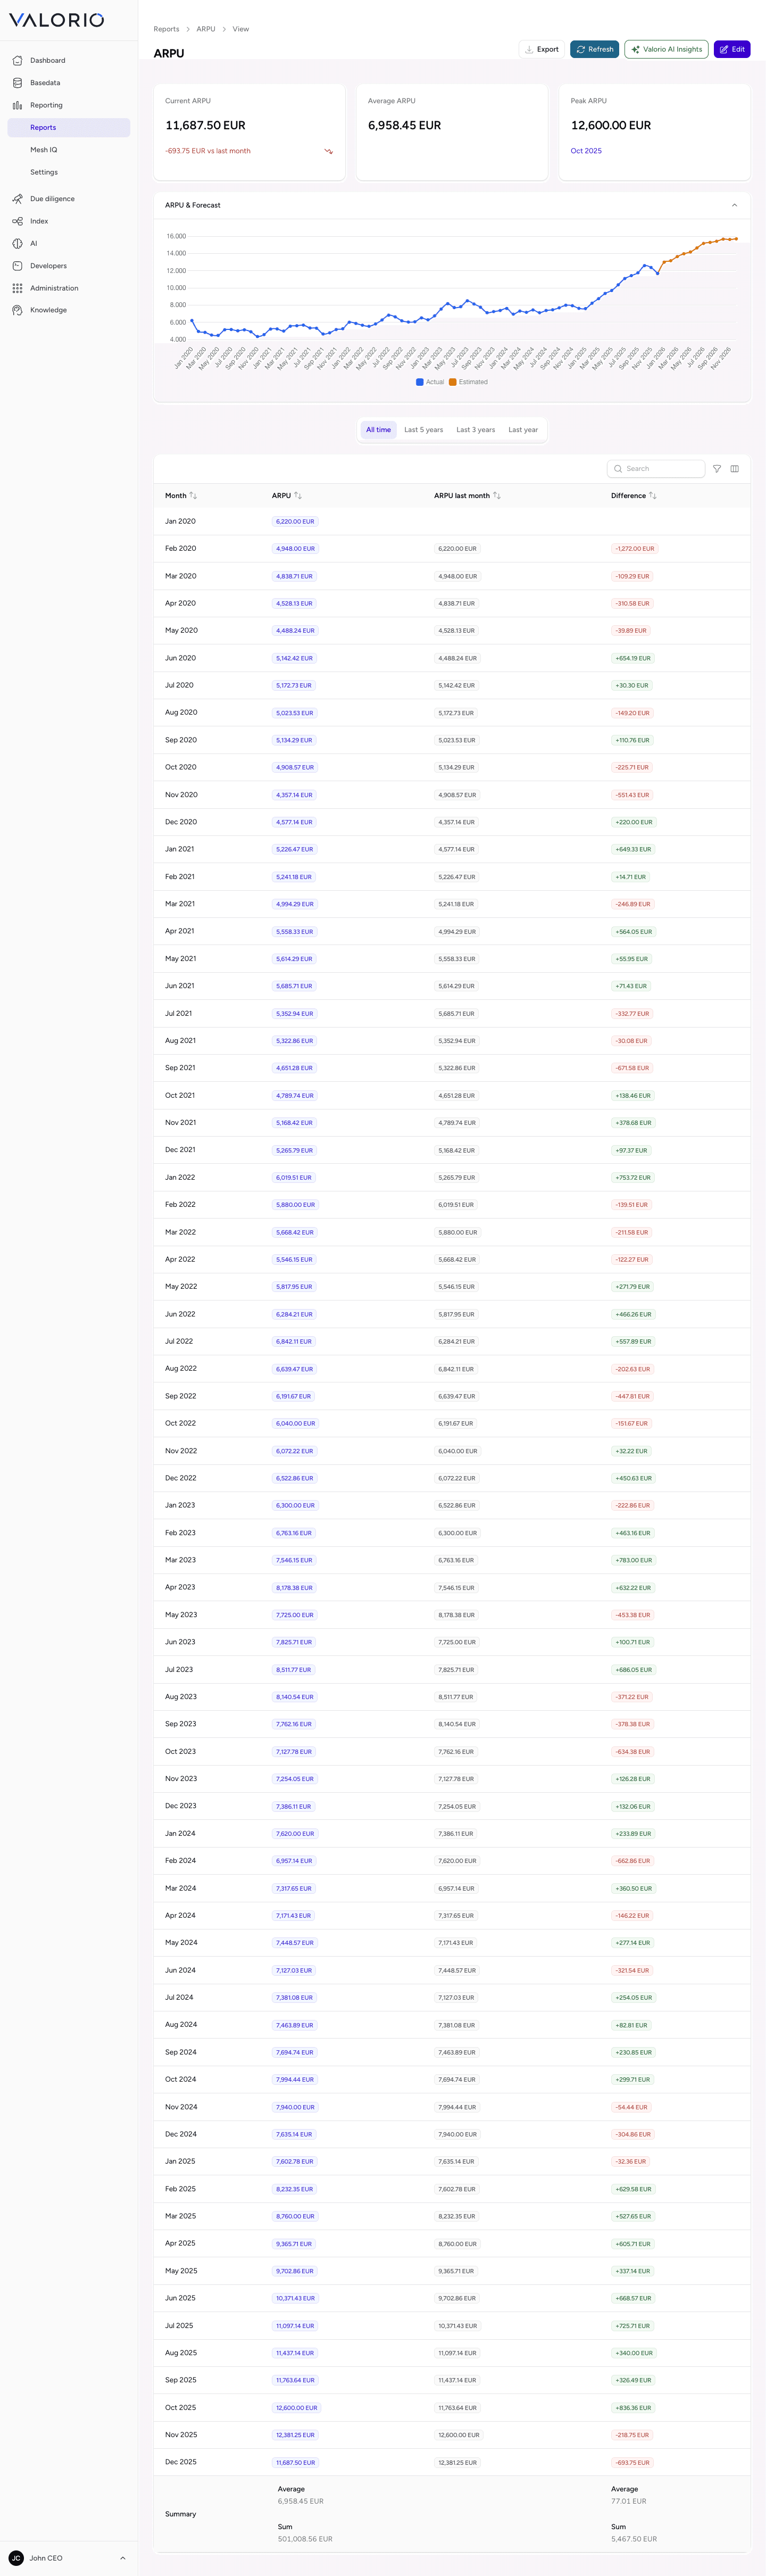
ARPU
Average Revenue Per User (ARPU) shows how much revenue each customer generates on average.
A buyer reads ARPU trend alongside customer count to tell whether growth is coming from more customers, bigger customers, or both.
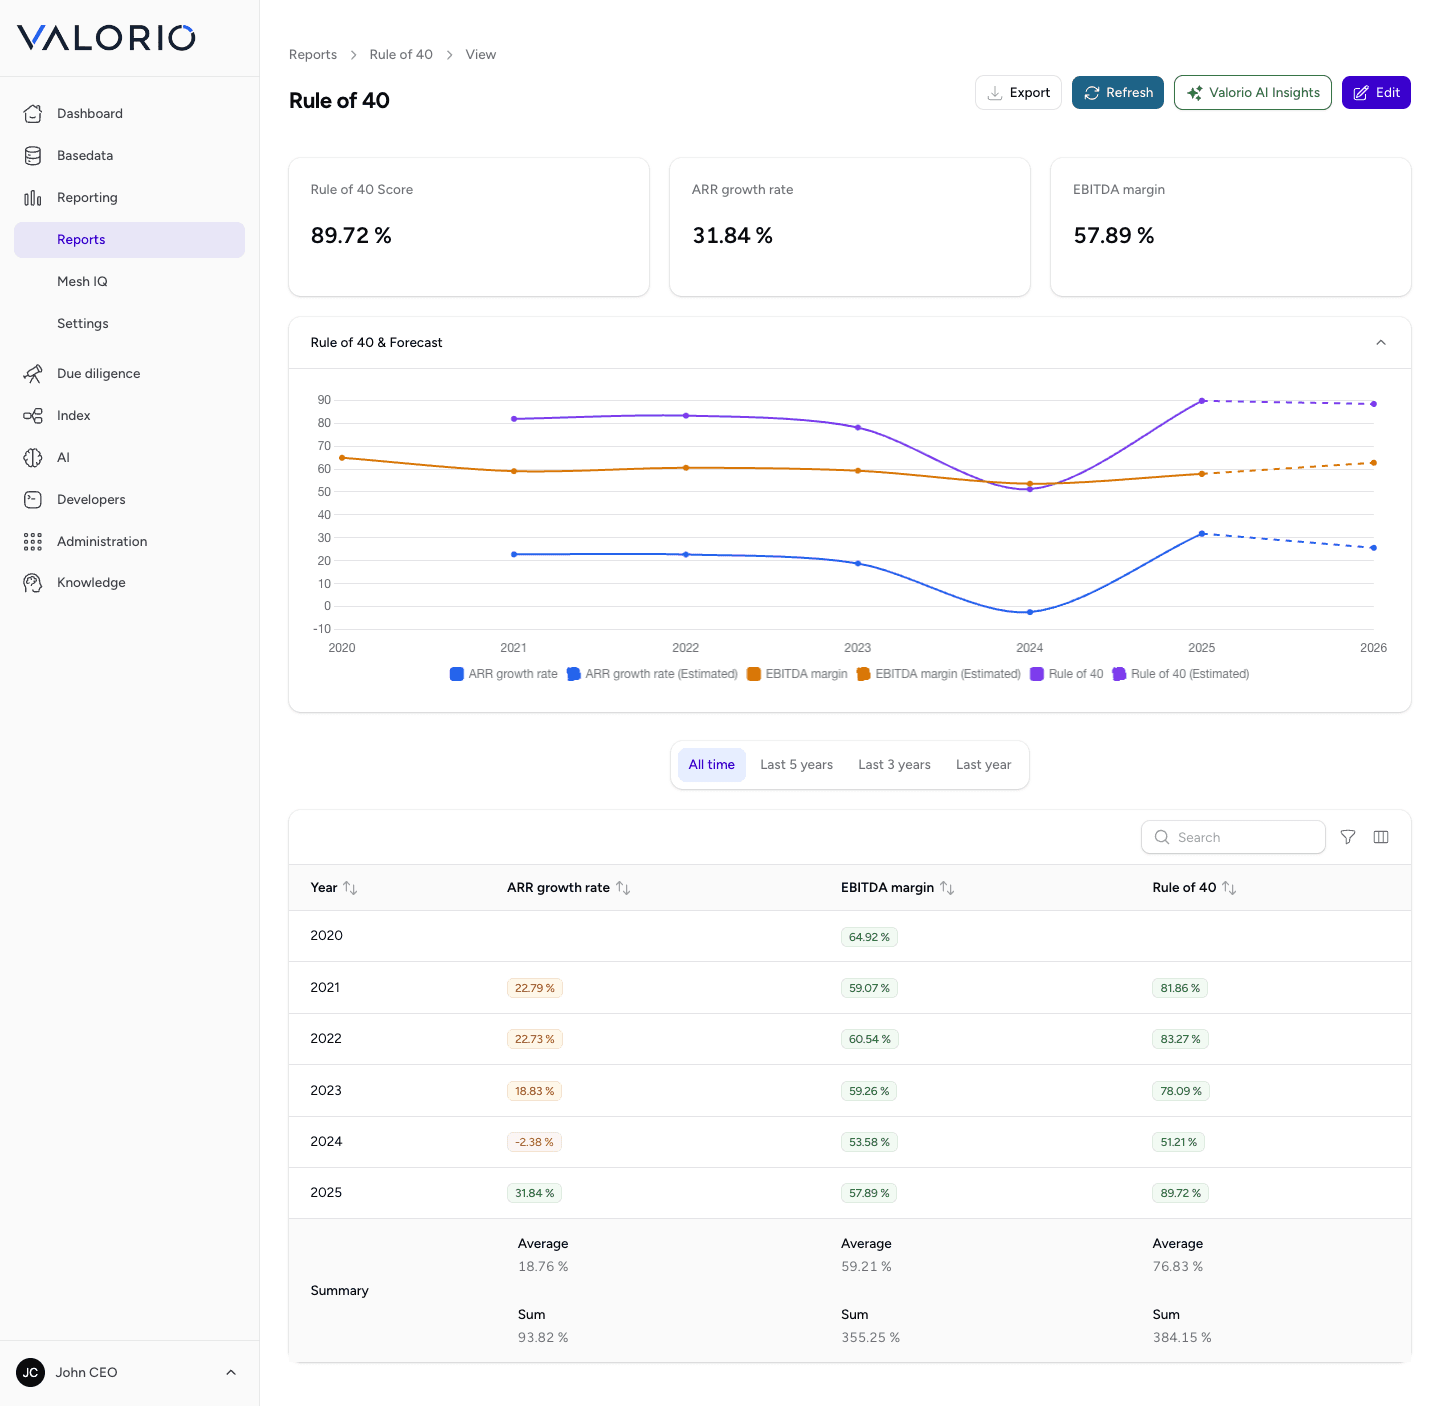
Rule of 40
The Rule of 40 combines growth and profitability to assess the overall health of the business — a company scoring at or above 40% (growth rate plus profit margin) is generally considered healthy for its stage.
It's a fast sanity check a buyer runs before digging into either number individually; note that it needs at least two comparable periods of data to compute a growth rate, so a young workspace may show "n/a" until more history accumulates.
EBITDA
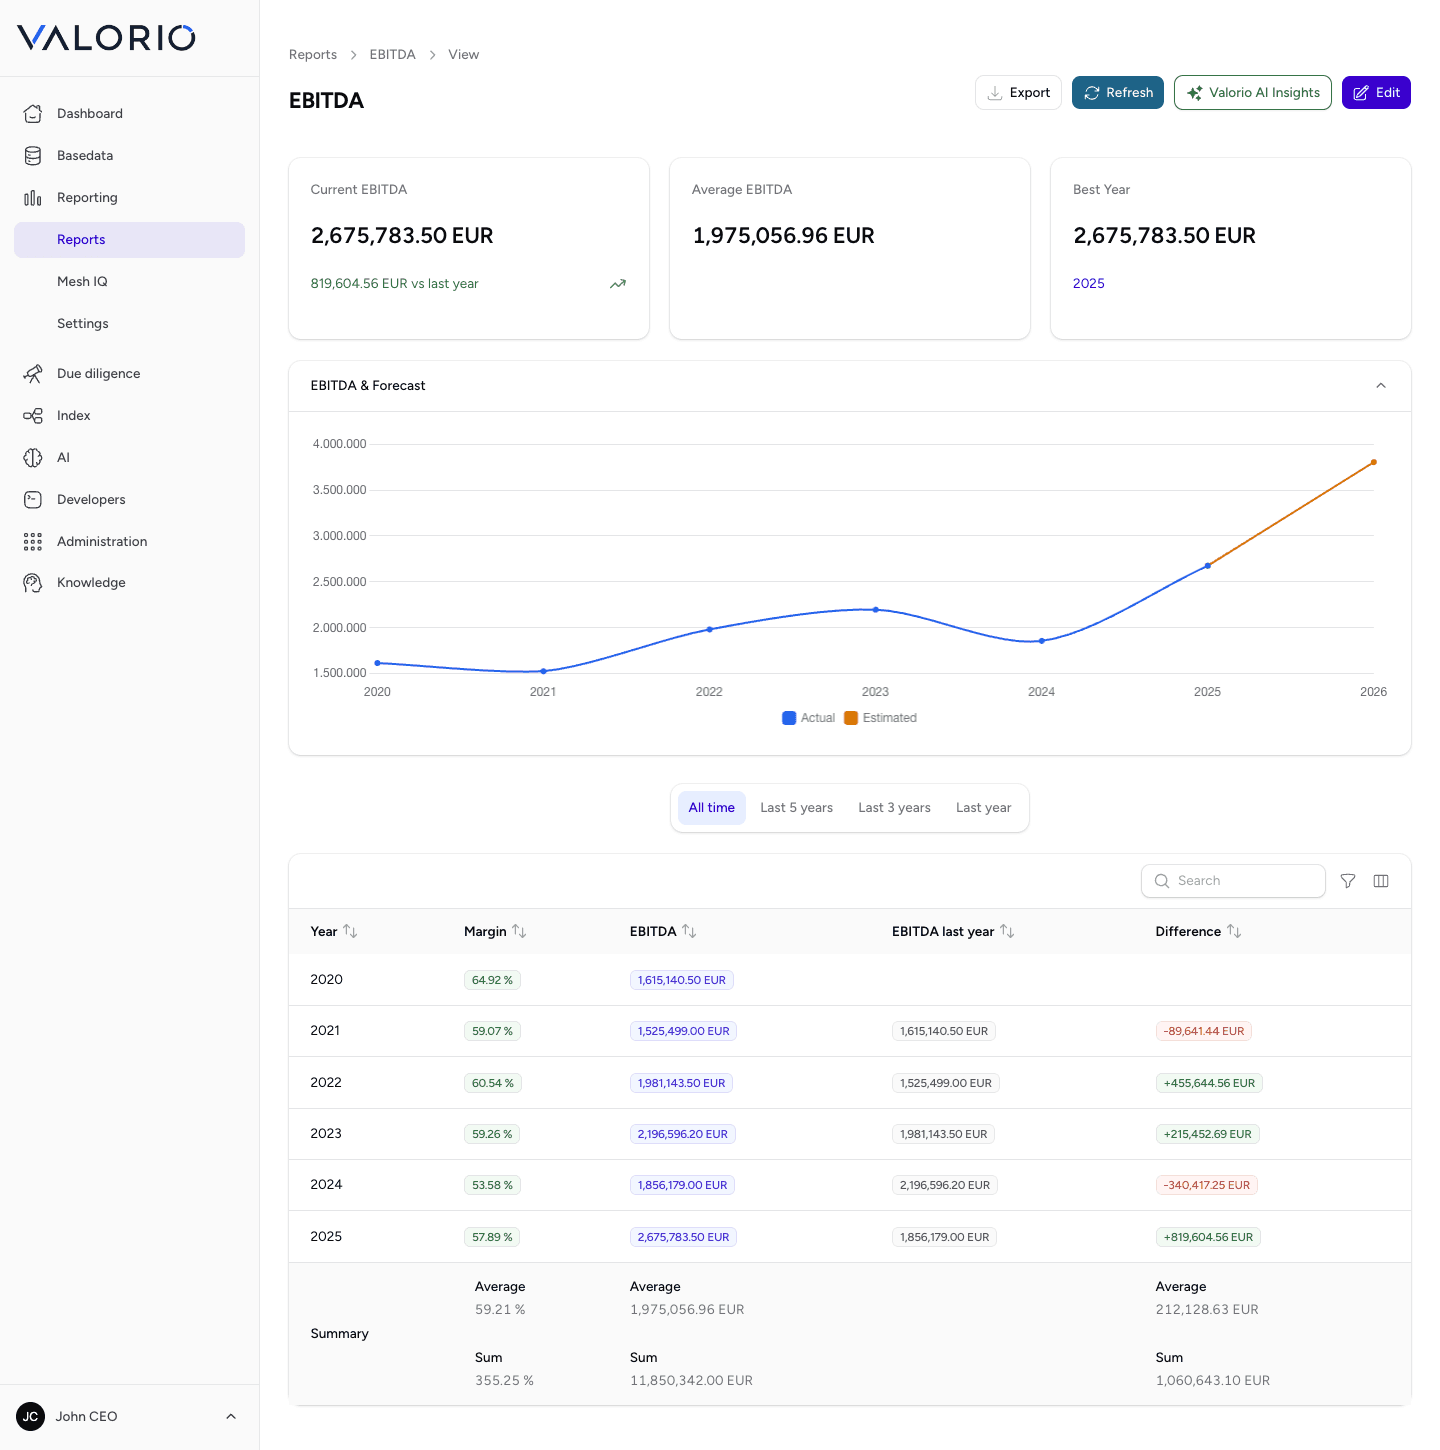
EBITDA measures operating profit before interest, taxes, depreciation, and amortization, making it easier to compare operational performance across companies with different capital structures.
It's the base most purchase-price multiples are actually applied to, so it's usually one of the first reports a buyer's financial advisor opens.
Gross margin
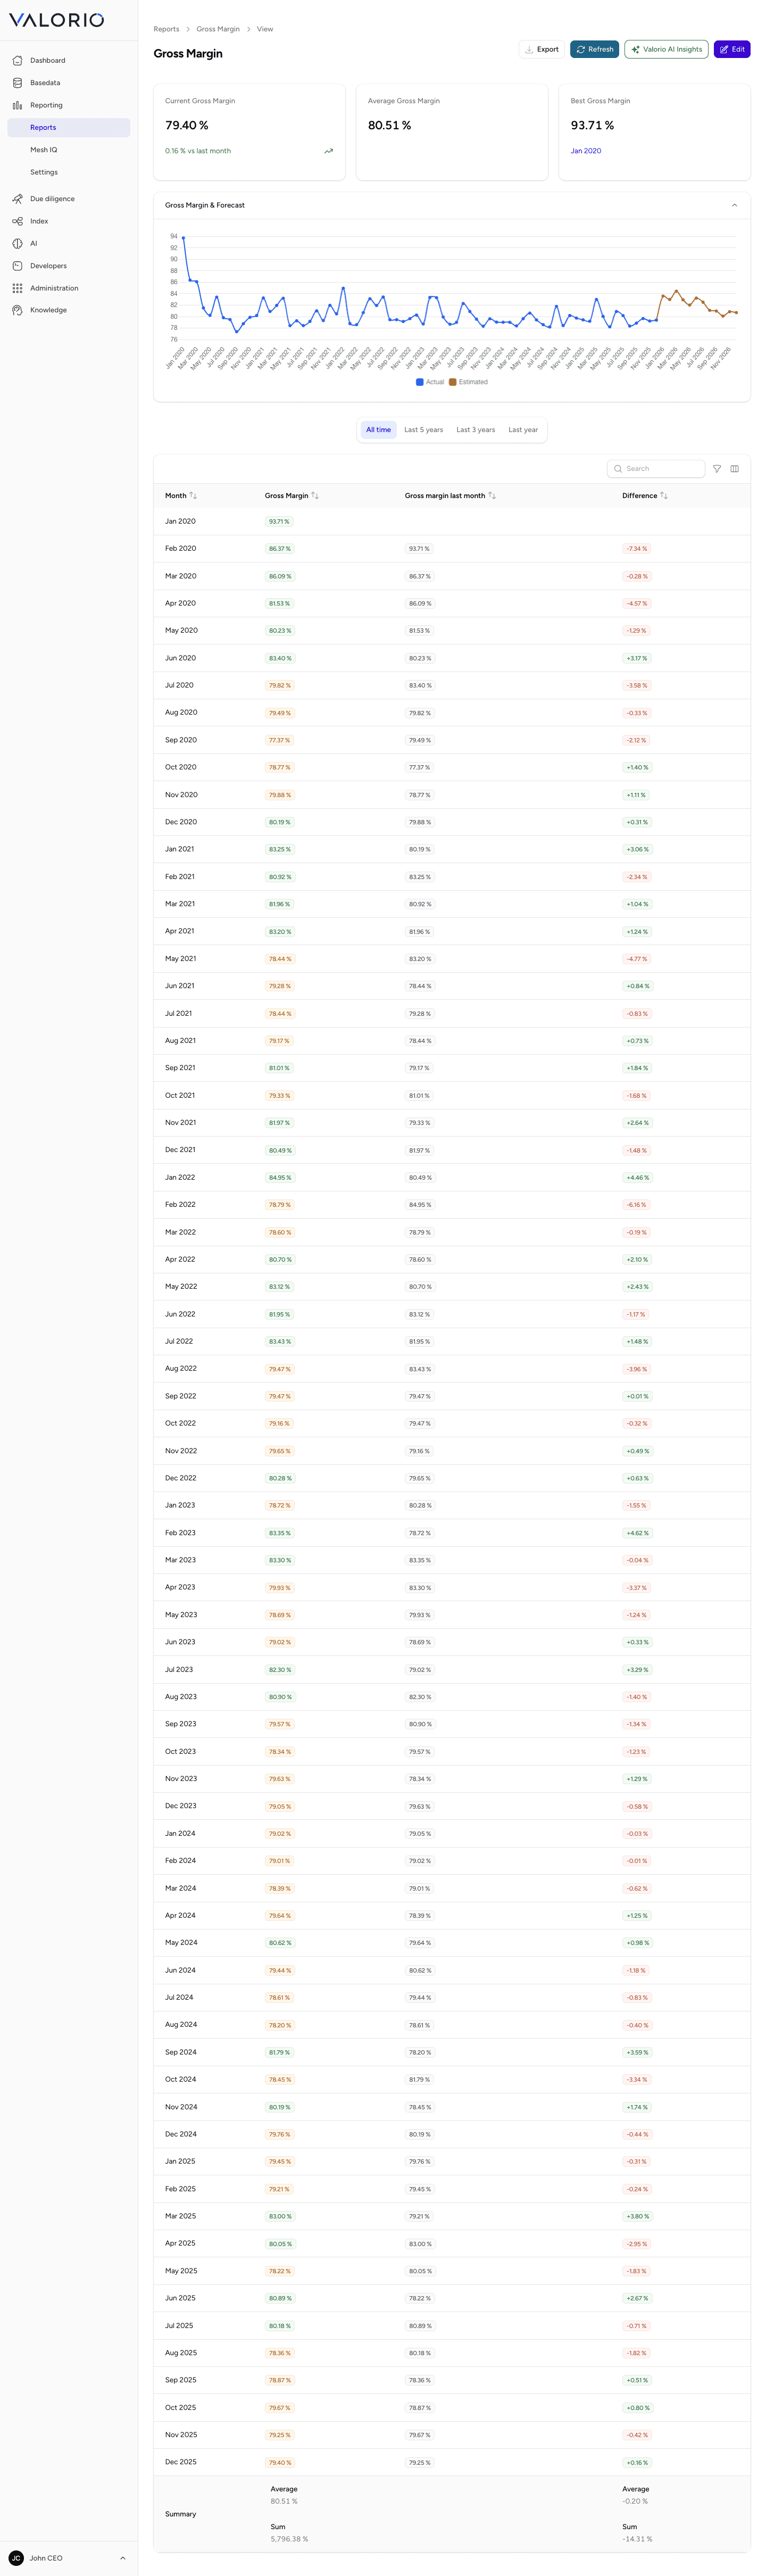
Gross Margin indicates how much revenue remains after direct costs have been deducted.
A software business with a materially lower gross margin than peers usually means service-heavy or infrastructure-heavy delivery — something a buyer will want explained before valuing the business like a pure-software company.
Operating margin
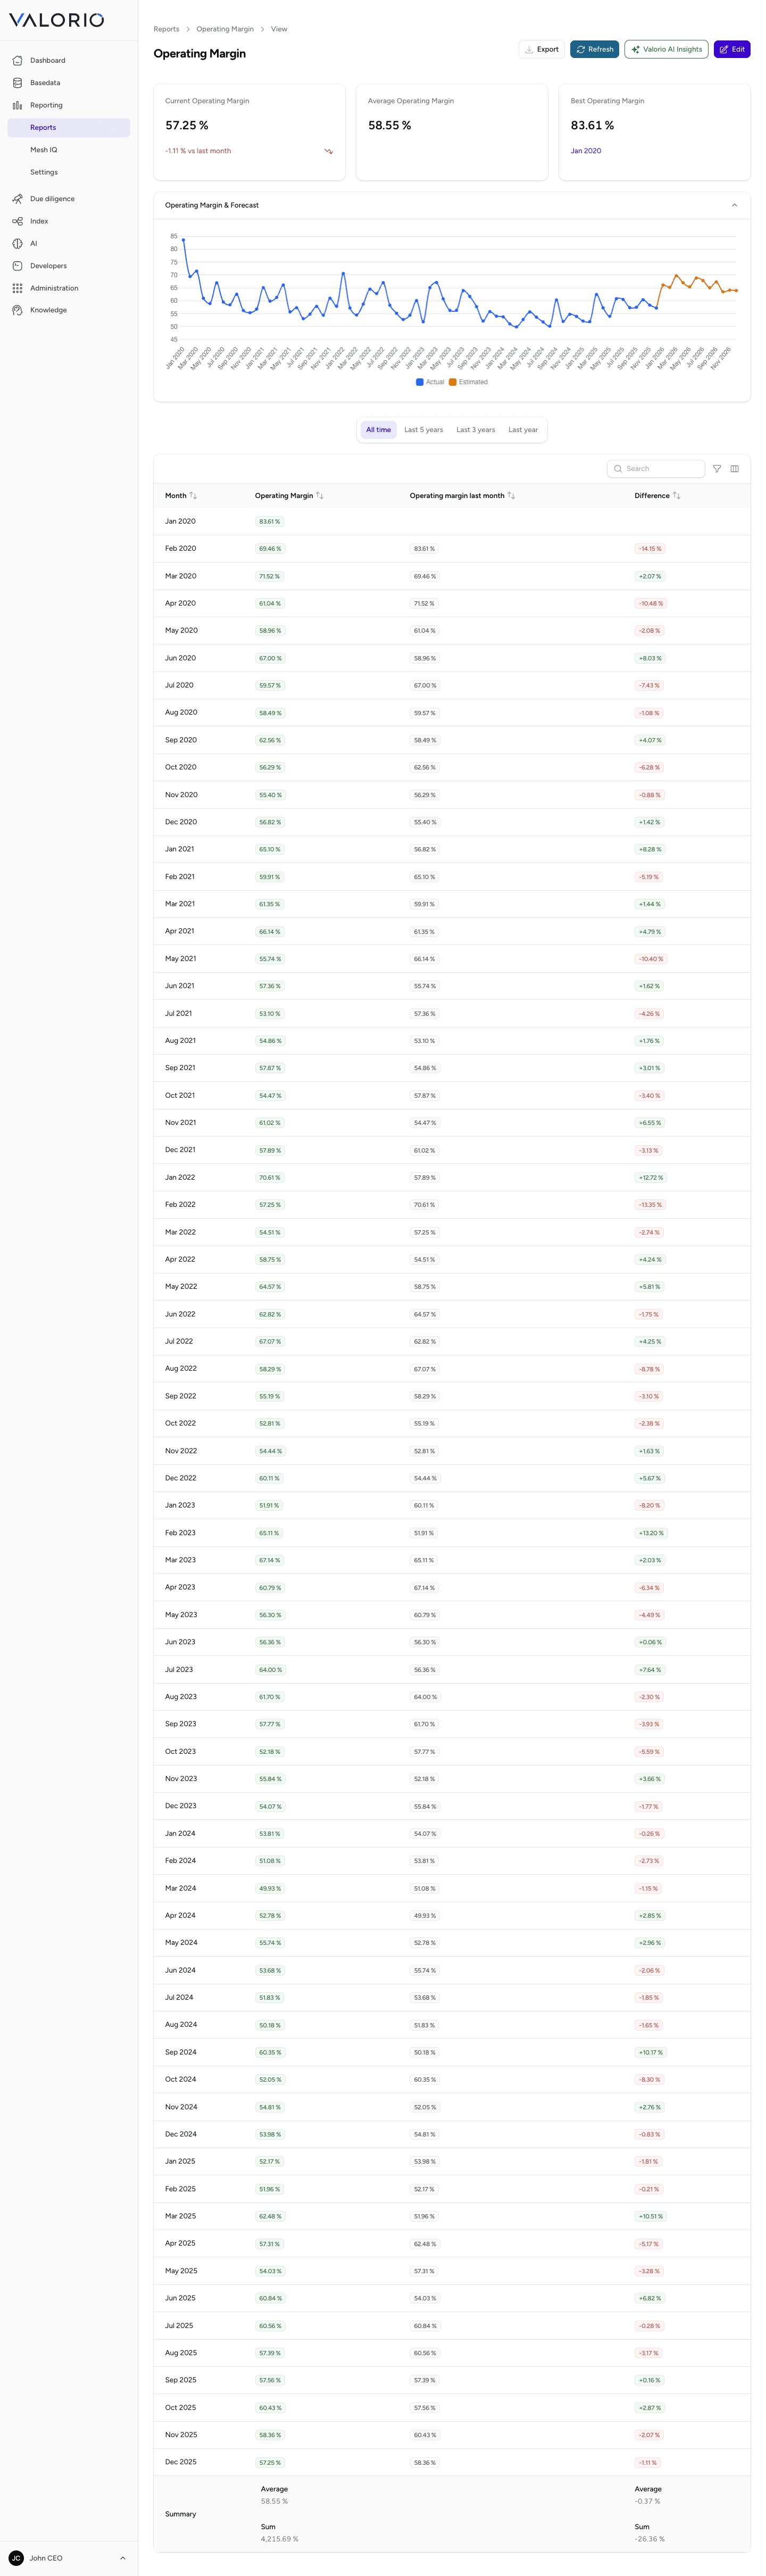
Operating Margin shows how much of your revenue remains as operating profit after covering operating expenses.
Read next to Gross Margin, it separates a cost-of-delivery problem from a cost-of-running-the-business problem — two very different stories to a buyer.
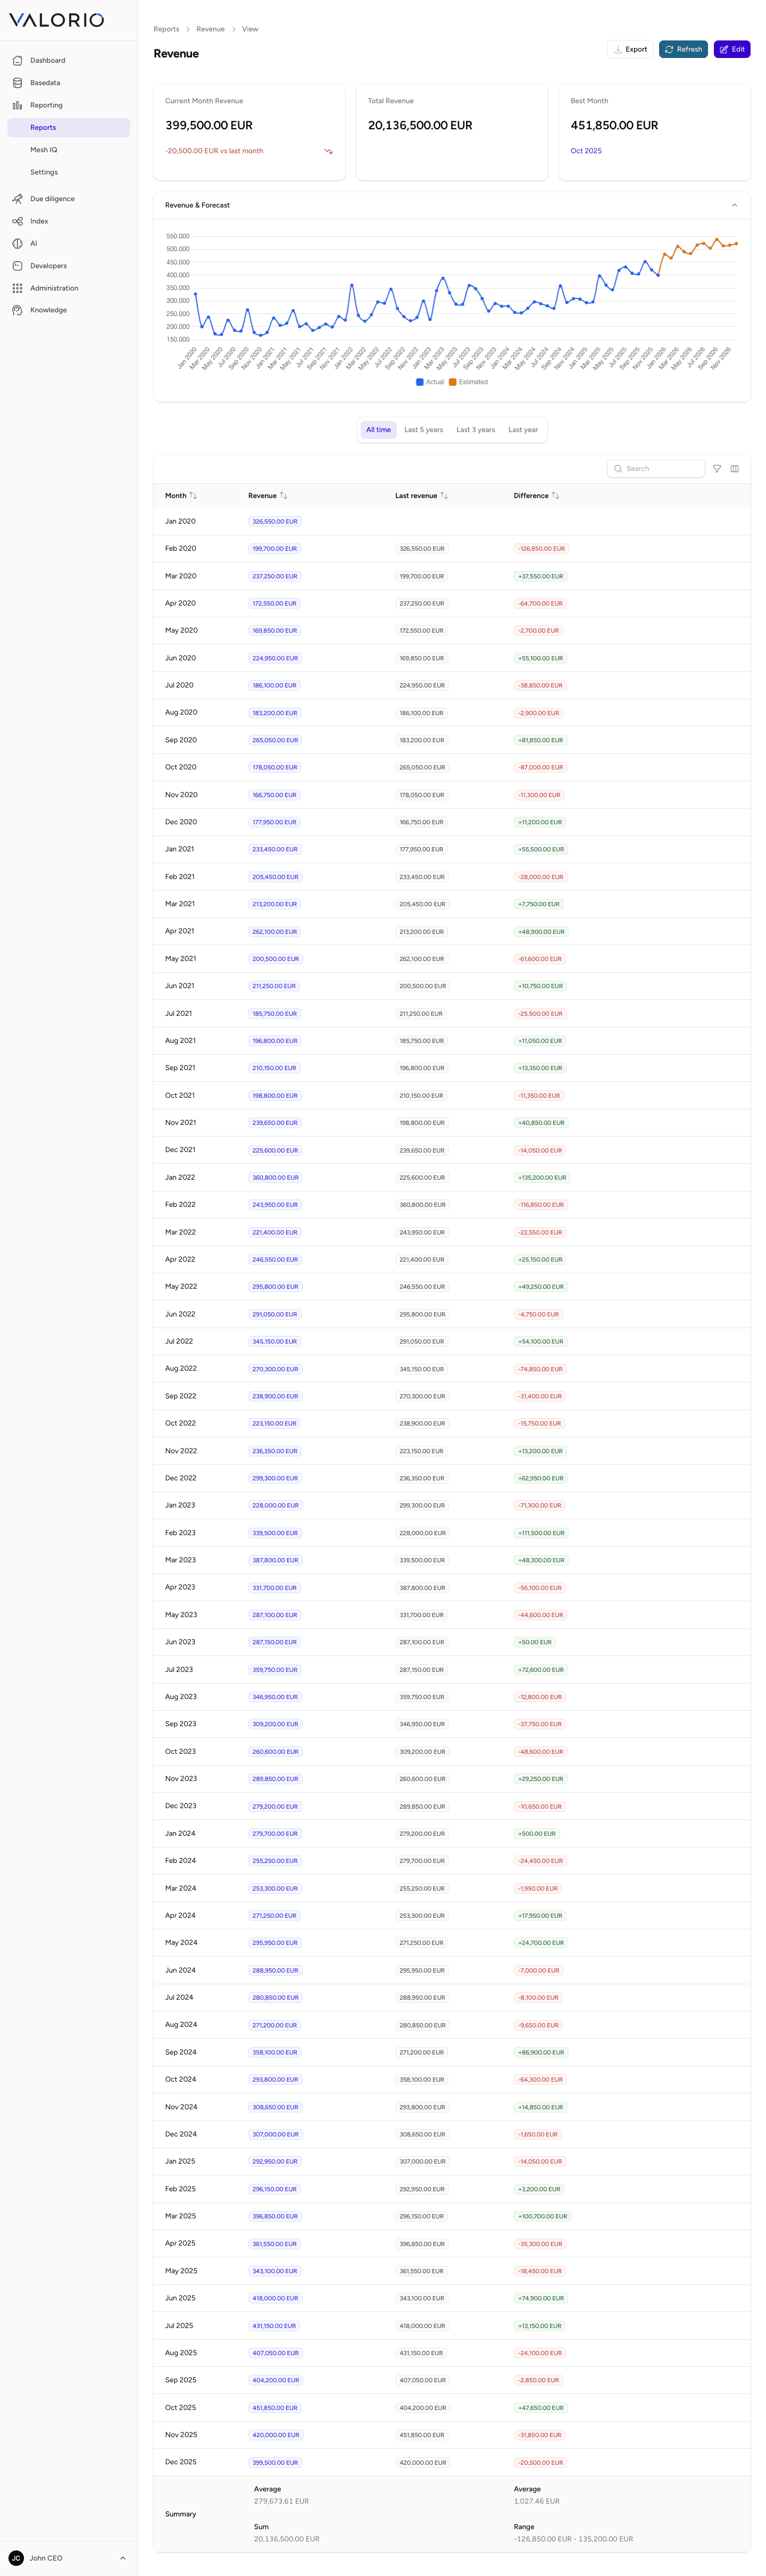
Revenue
Provides an overview of total revenue generated from products and services.
Unlike MRR/ARR, this includes non-recurring revenue too, so the gap between Revenue and ARR is itself informative — a wide gap means a meaningful chunk of the business isn't subscription income.
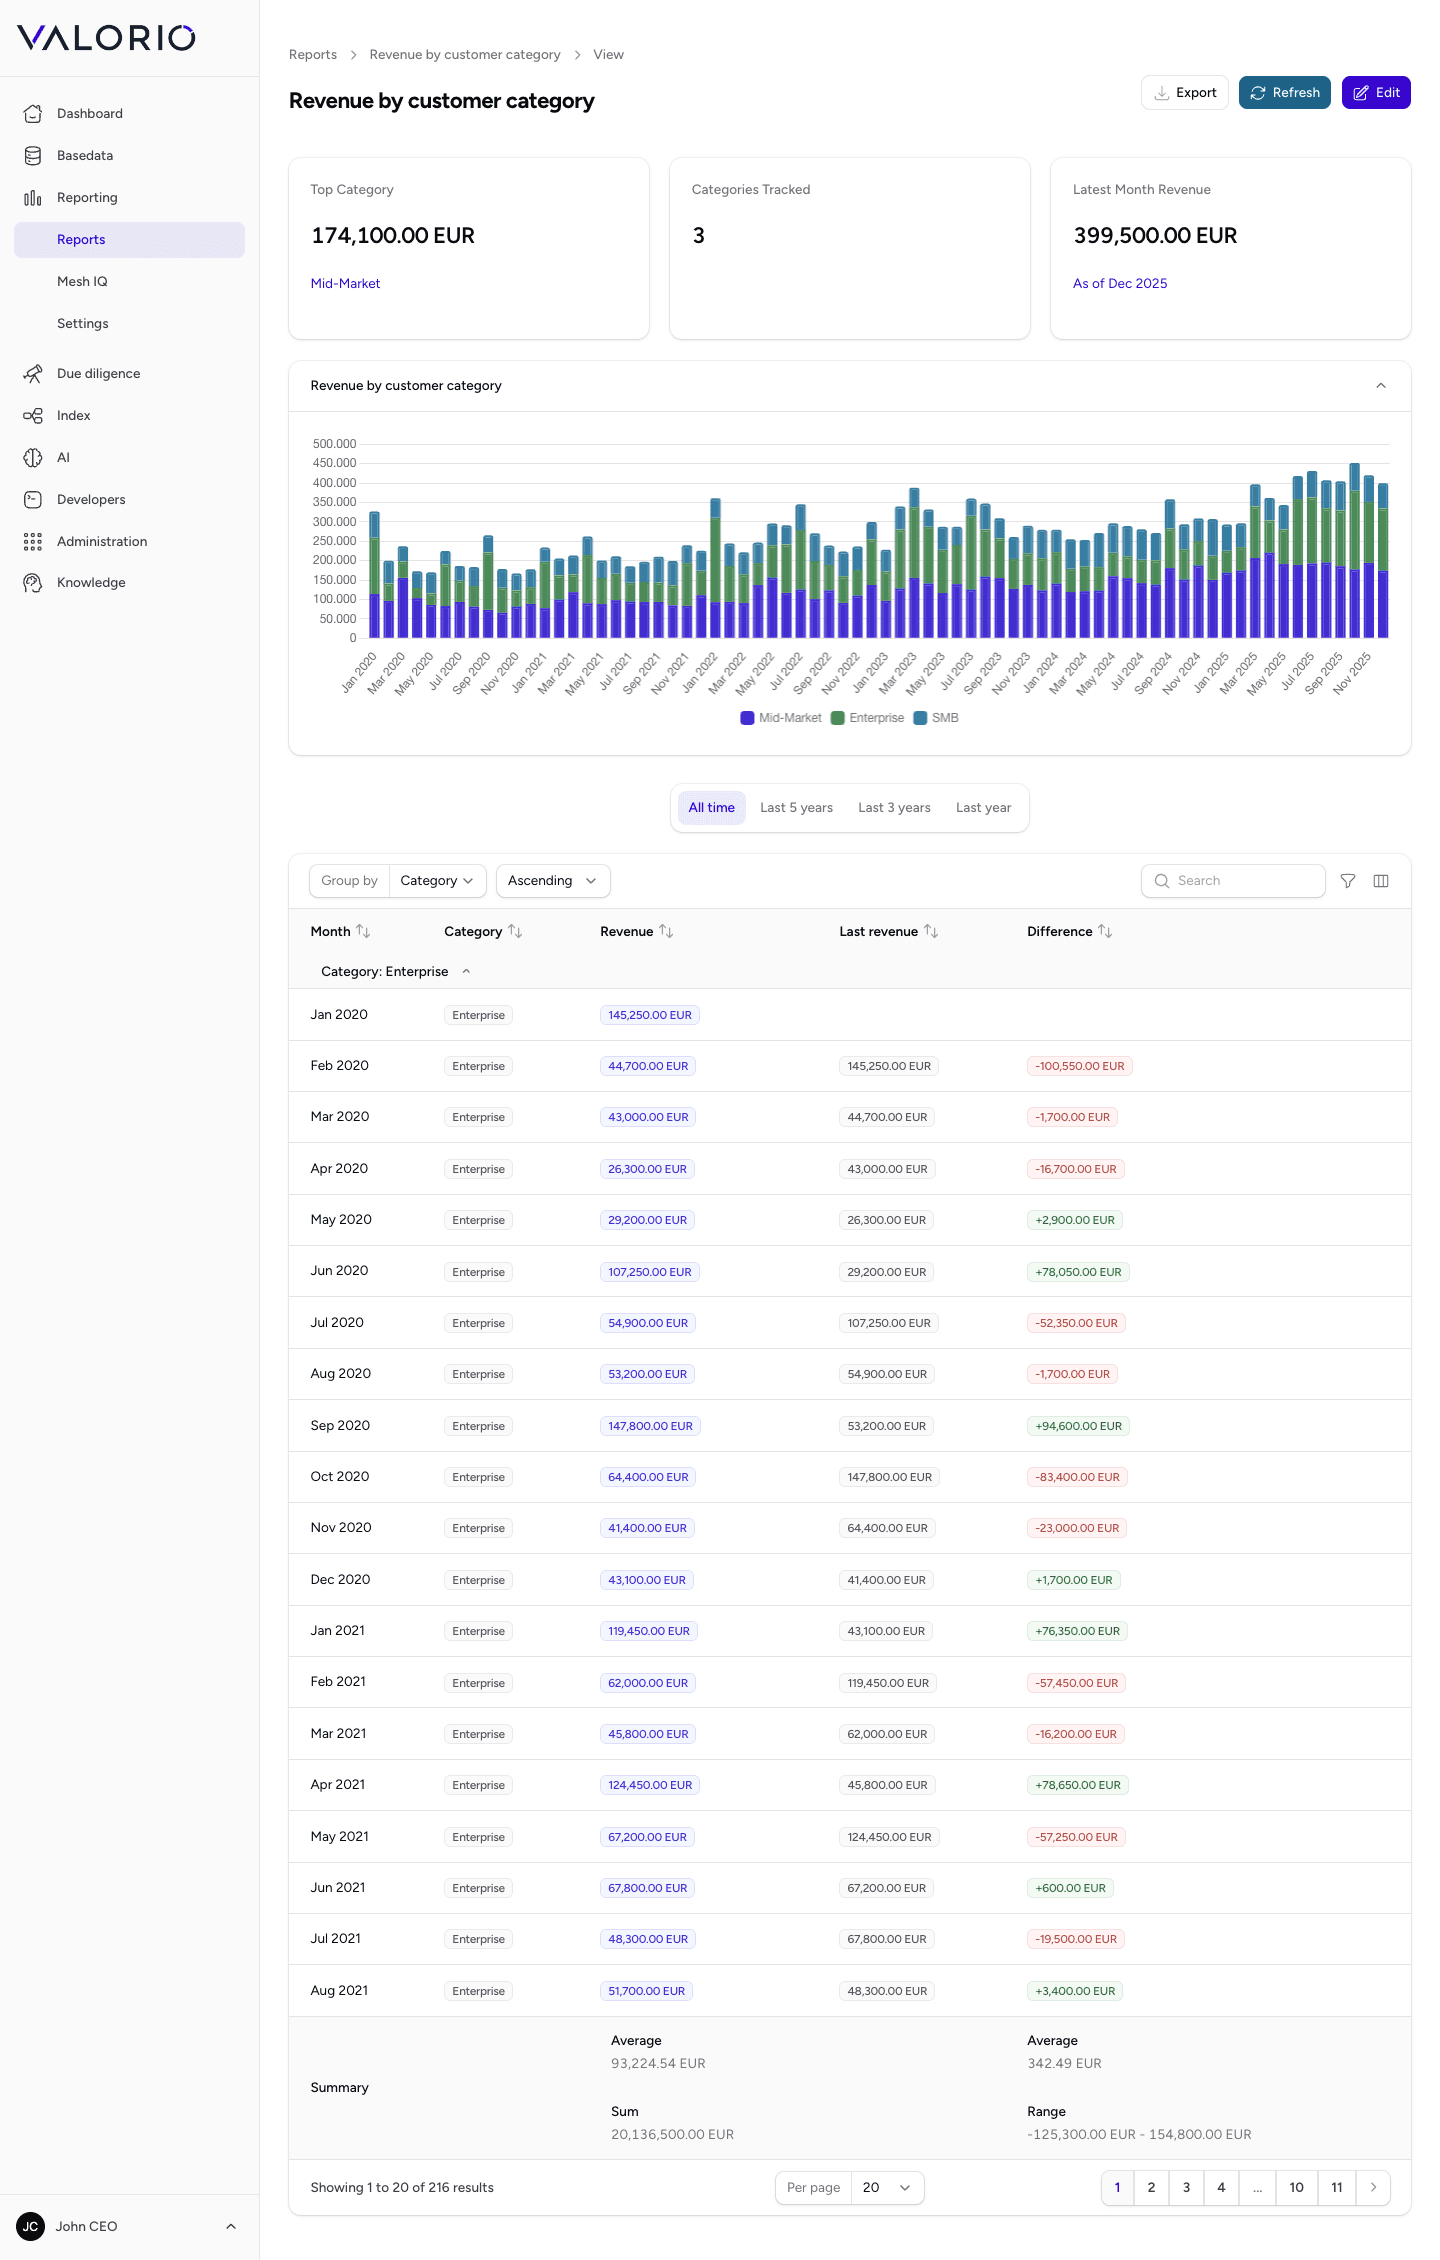
Revenue by customer category
Analyze how revenue is distributed across different customer categories.
Useful for spotting whether growth is concentrated in one segment — a red flag if that segment is also the one facing the most competitive or regulatory pressure.
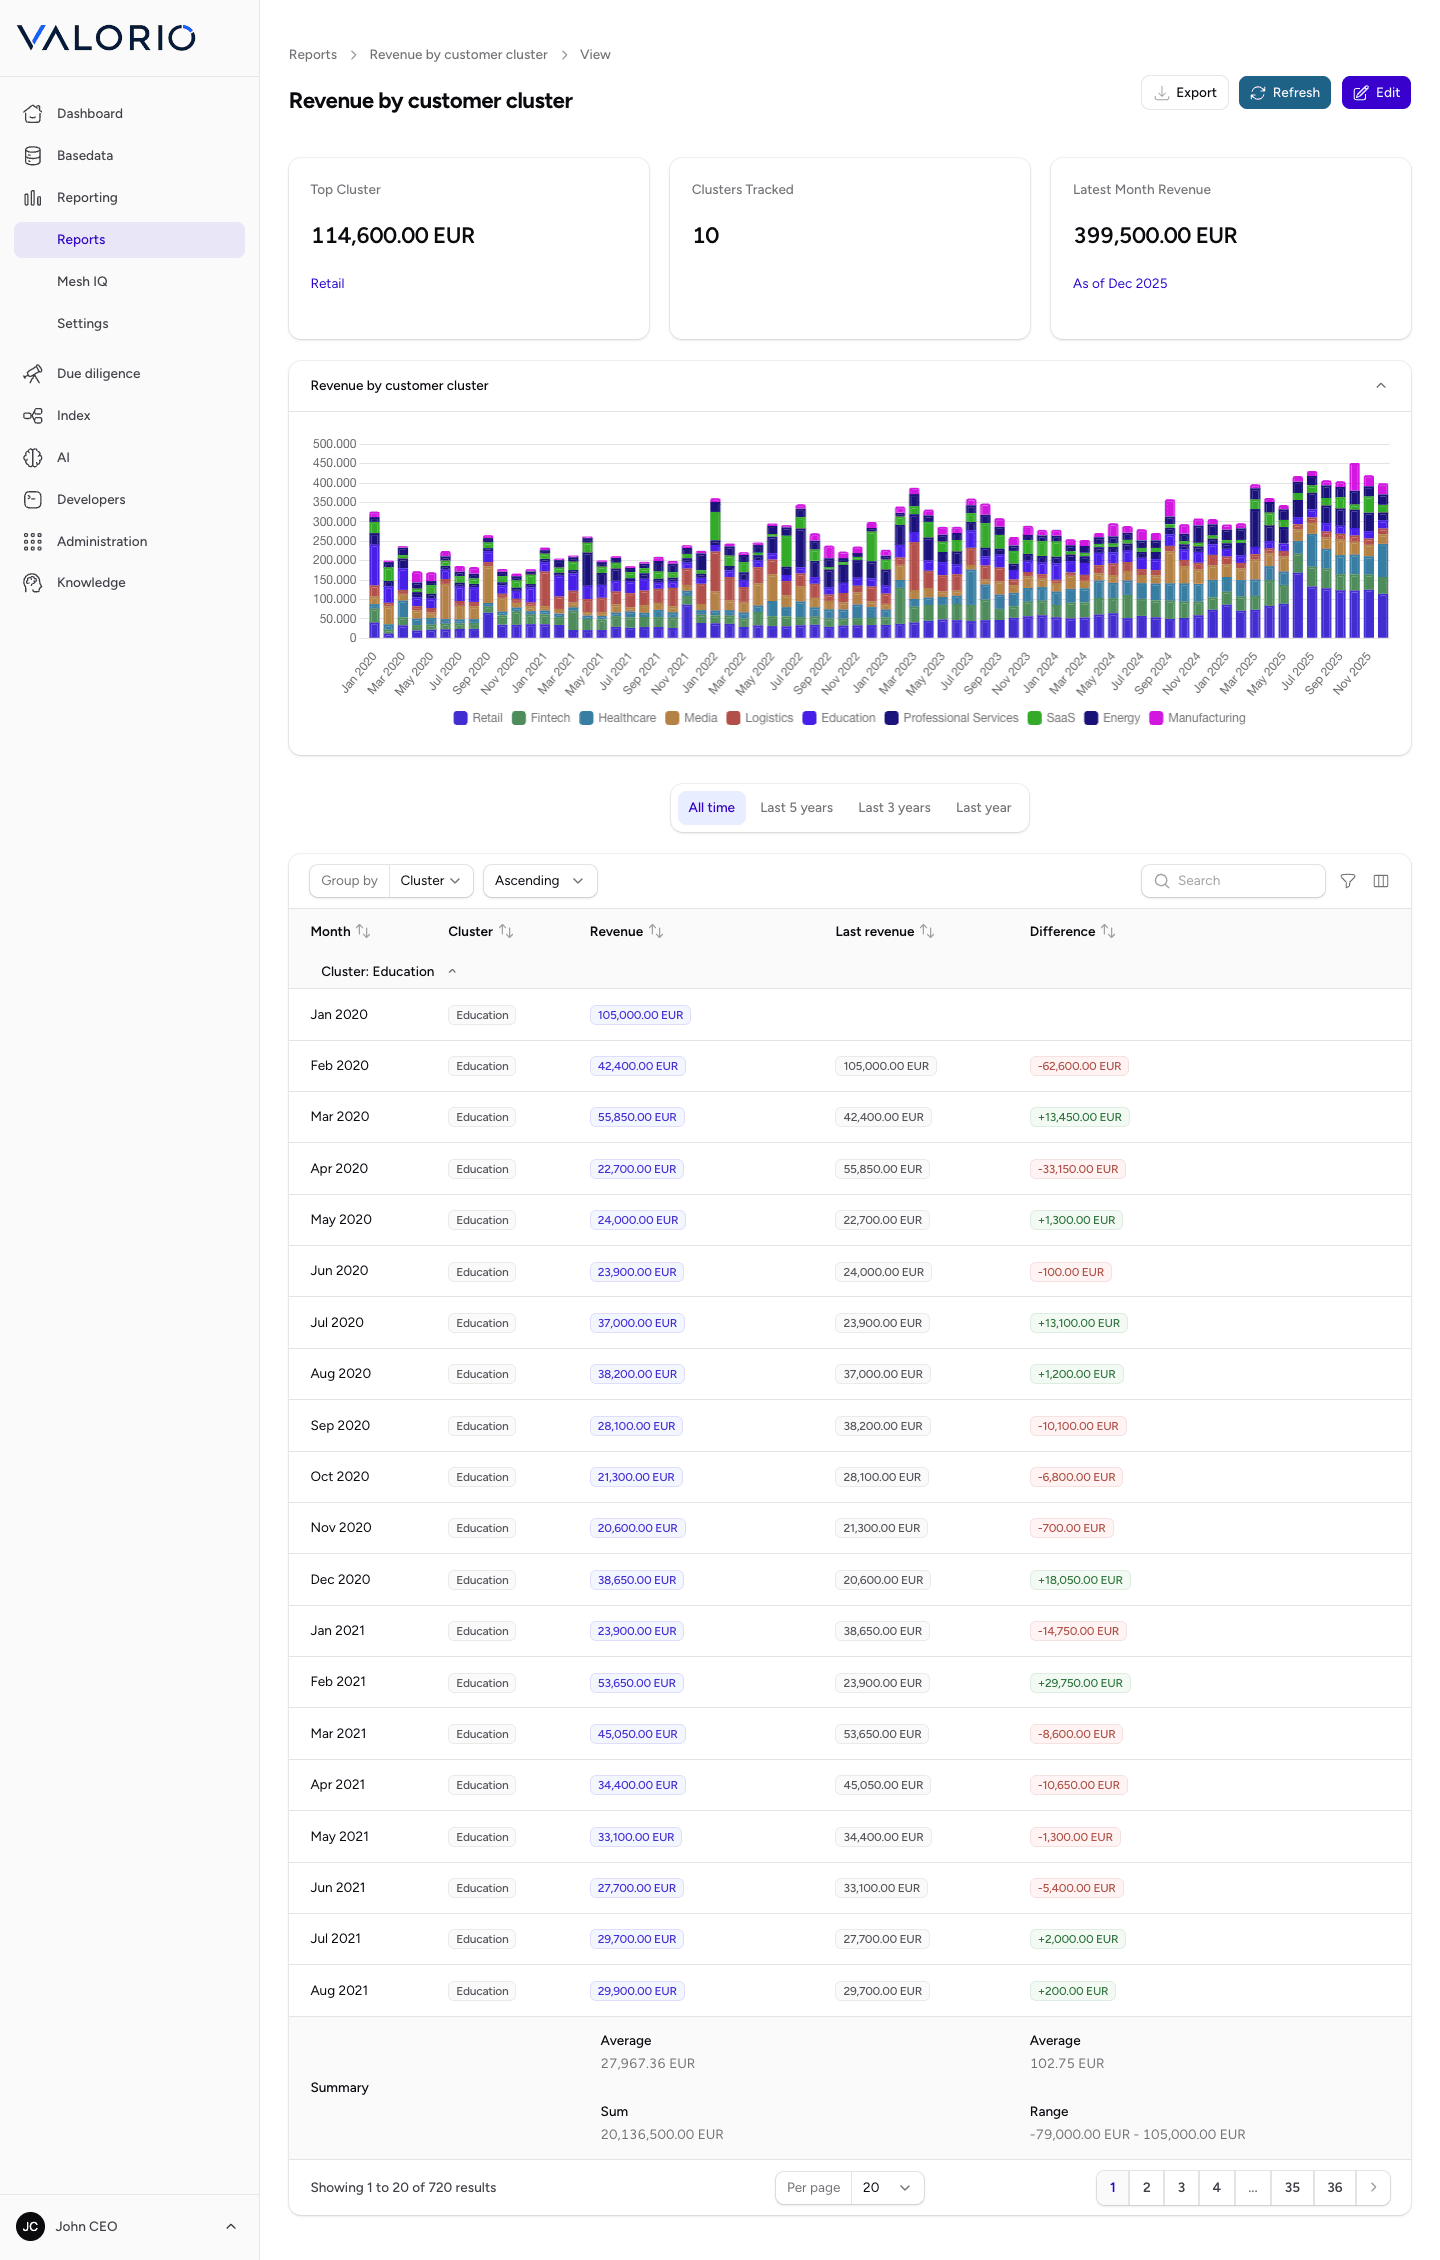
Revenue by customer cluster
Shows how revenue is distributed among customer clusters.
Clusters group customers by behavior rather than a fixed category, so this is where an analyst looks for concentration risk a category-based view might not surface — for example several "different" customers that actually behave, and could churn, together.
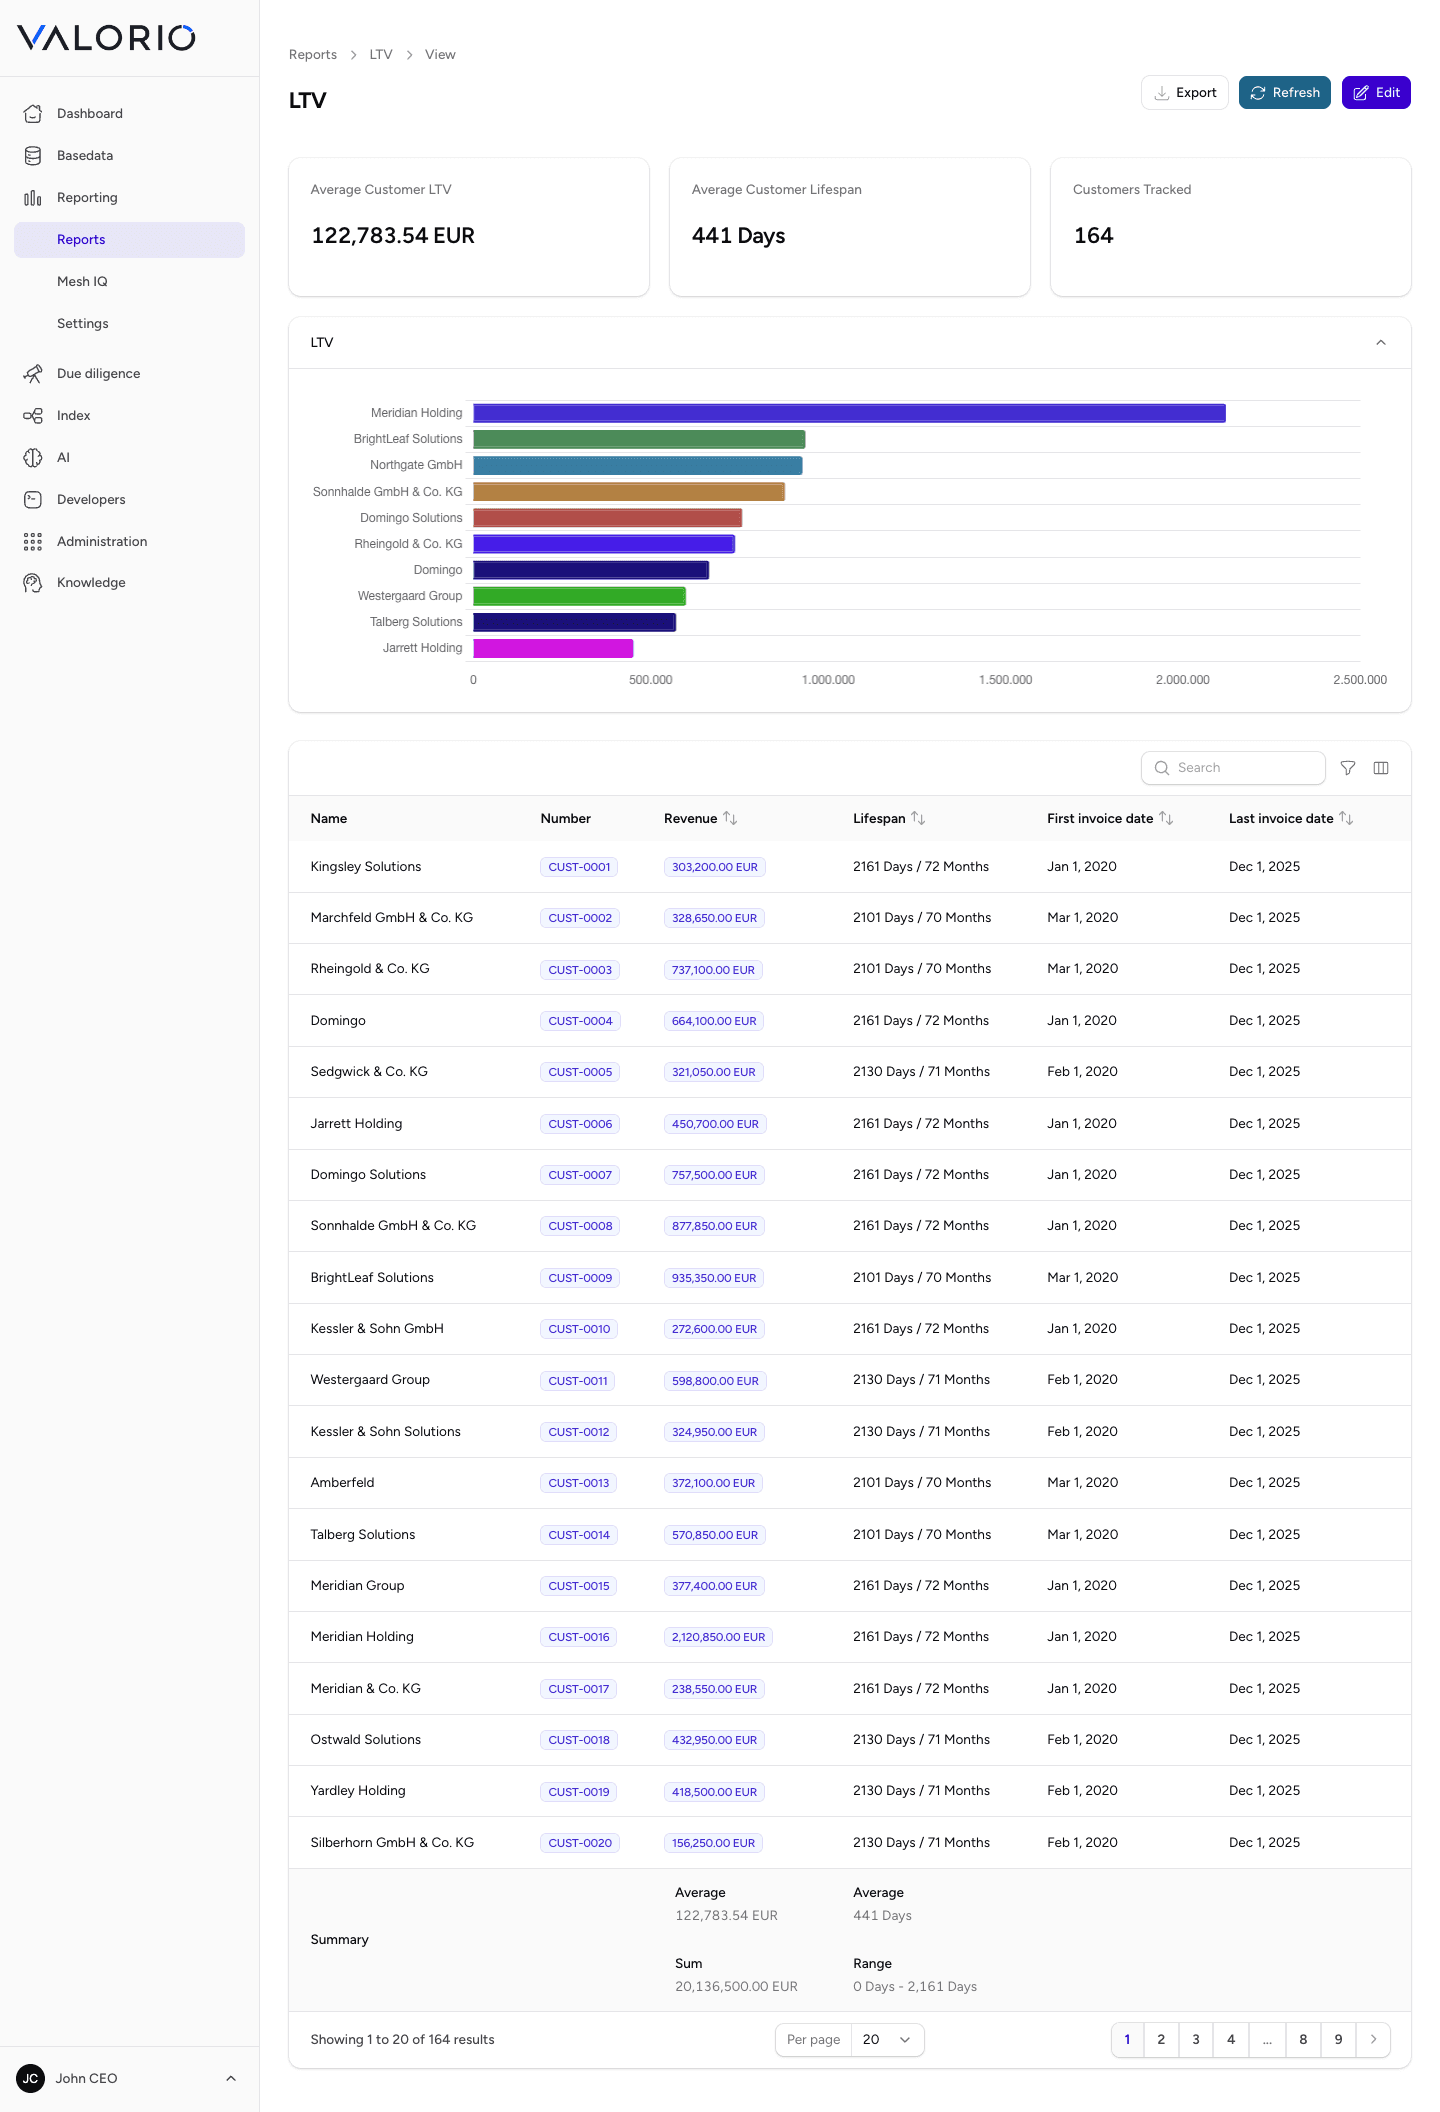
LTV
Lifetime Value (LTV) estimates the total value a customer generates over the entire relationship with your business.
Compared against customer acquisition cost, it's the standard test of whether the growth engine is actually profitable — not just fast.
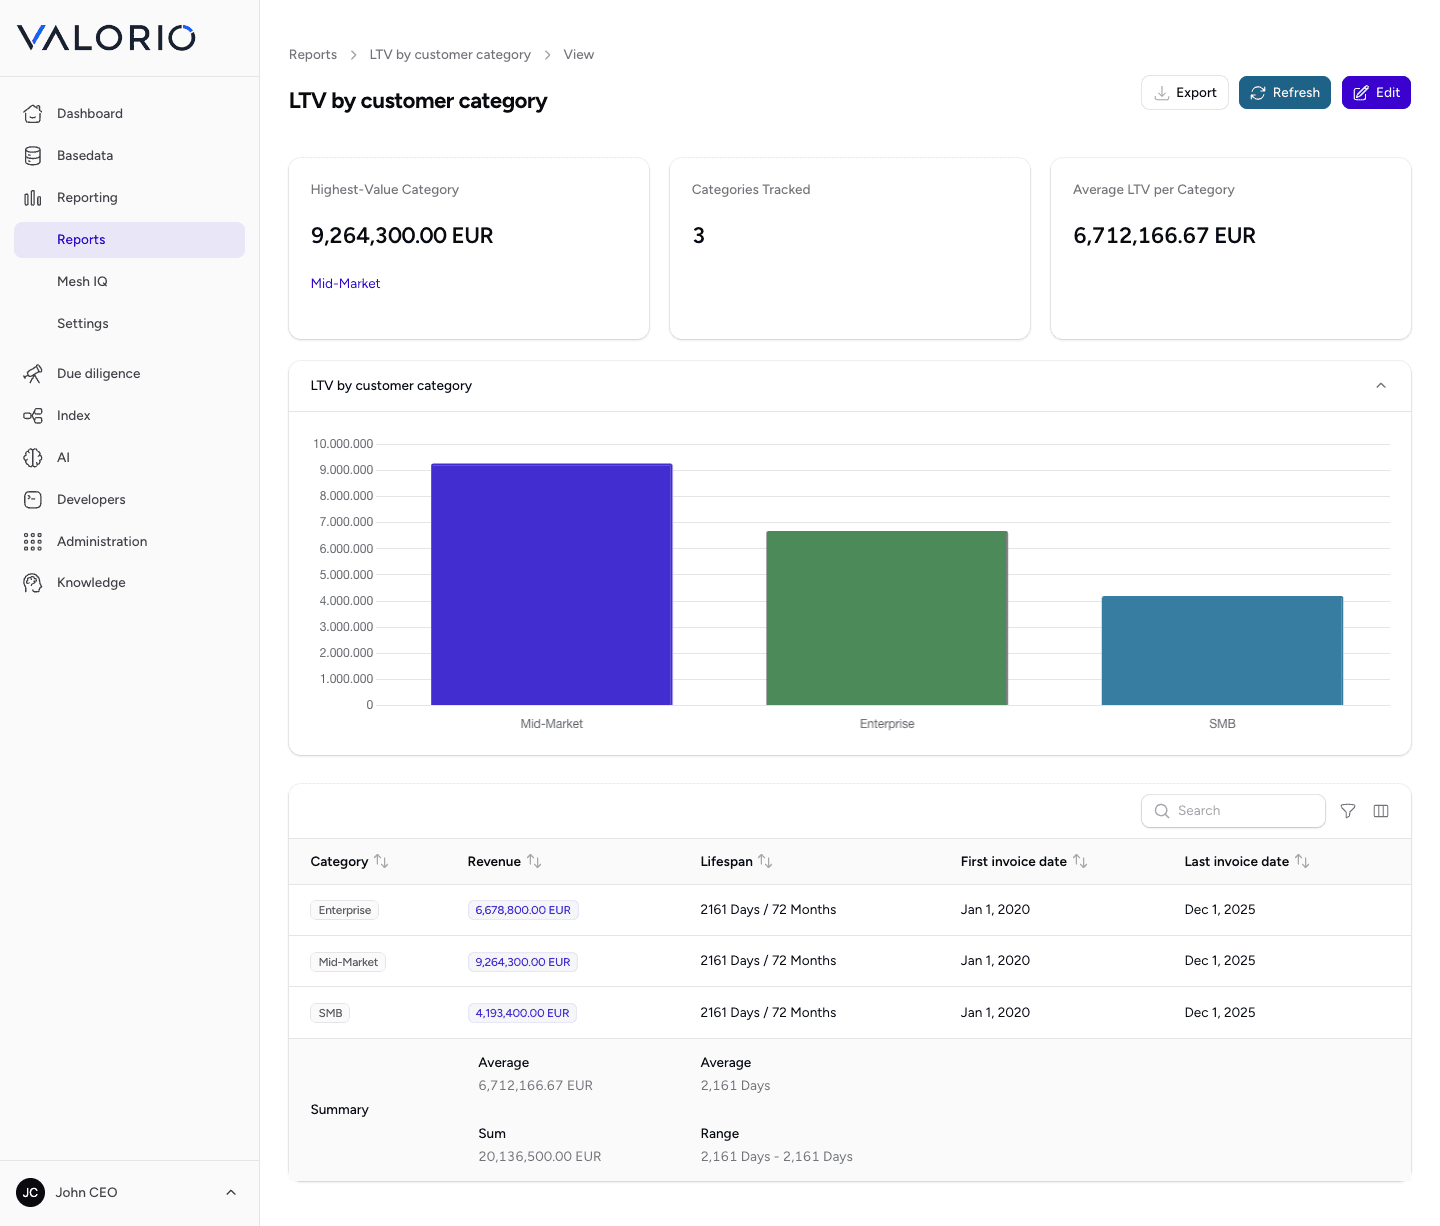
LTV by customer category
Breaks down Lifetime Value by customer category and highlights differences between segments.
Lets a buyer see whether the highest-value customers sit in a segment the business can still win more of, or one that's already saturated.
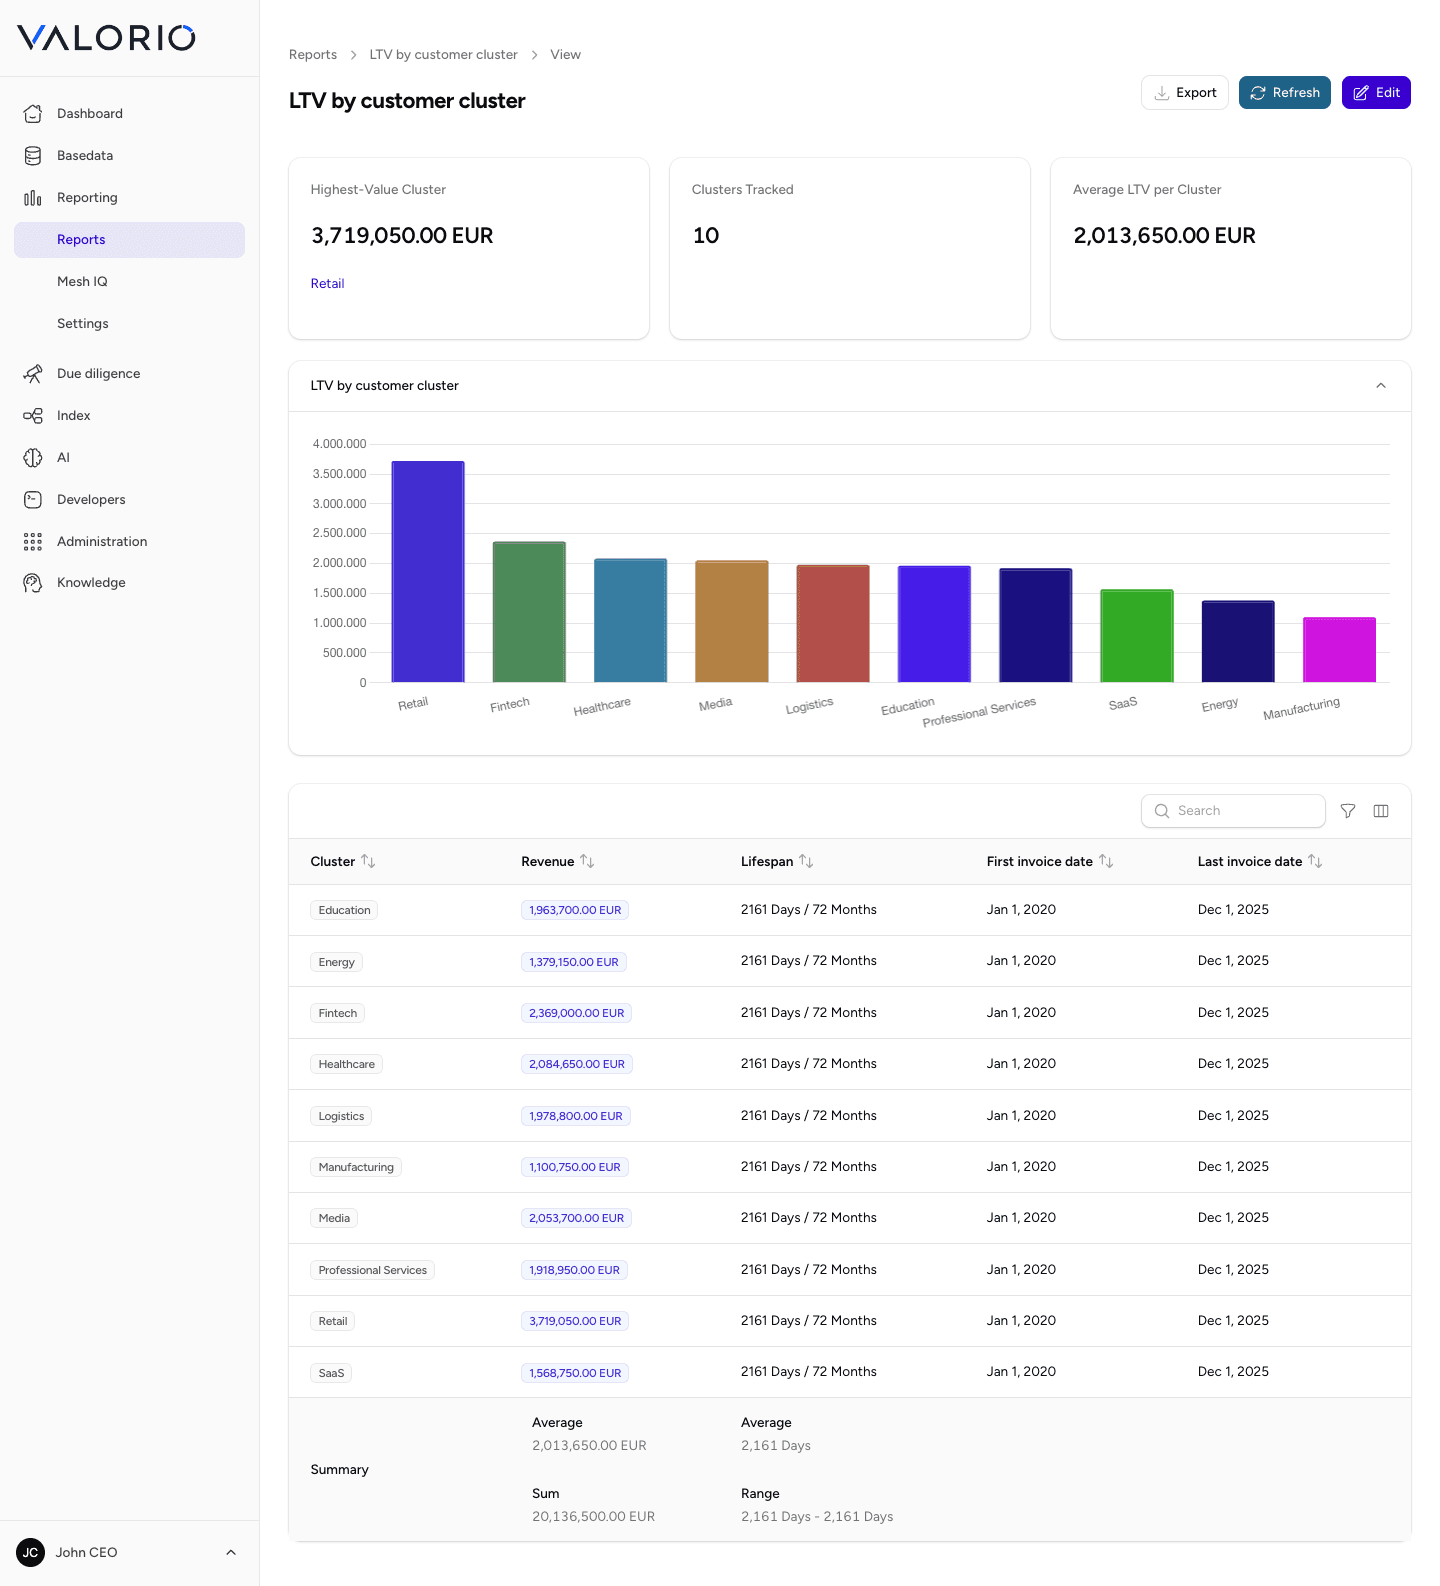
LTV by customer cluster
Analyzes Lifetime Value across customer groups and helps evaluate the value of individual clusters.
Pairs with Revenue by customer cluster to show not just who the revenue comes from today, but which clusters are worth the most to keep.
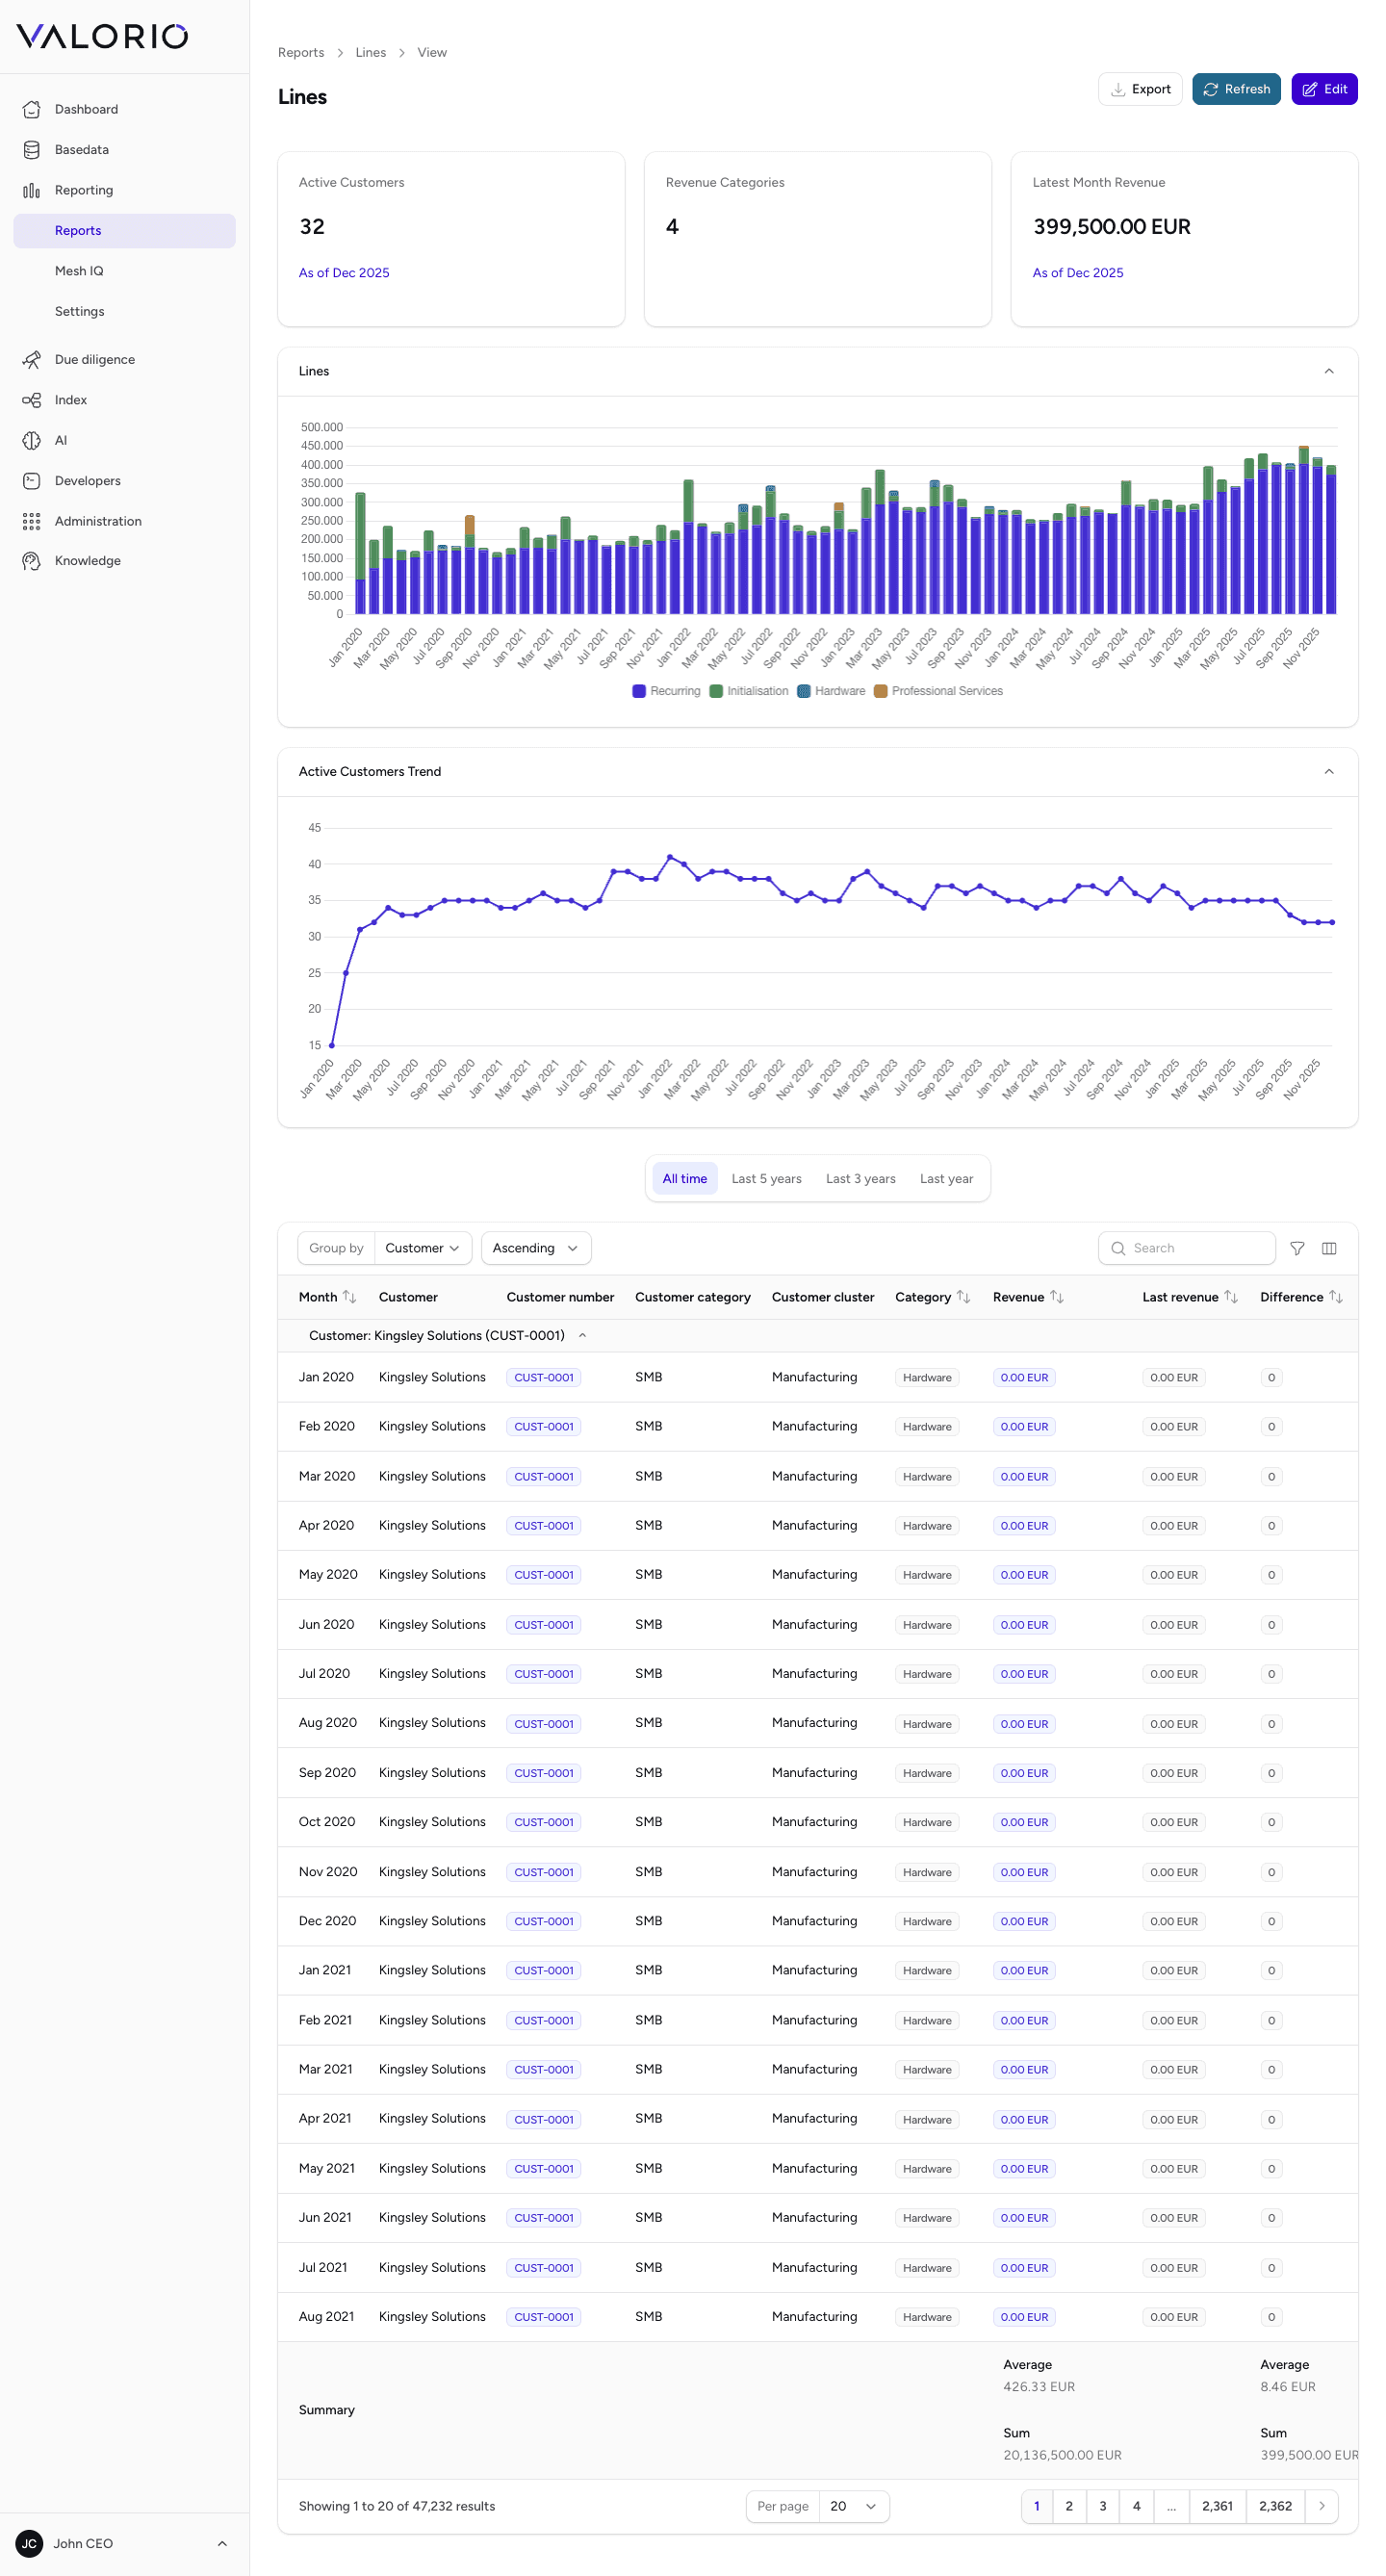
Lines
Detailed breakdown of customer activity and revenue, organized by revenue category.
This is the line-item level underneath every other report — the one a diligence analyst drops into when a summary number needs to be traced back to the individual transactions that produced it.
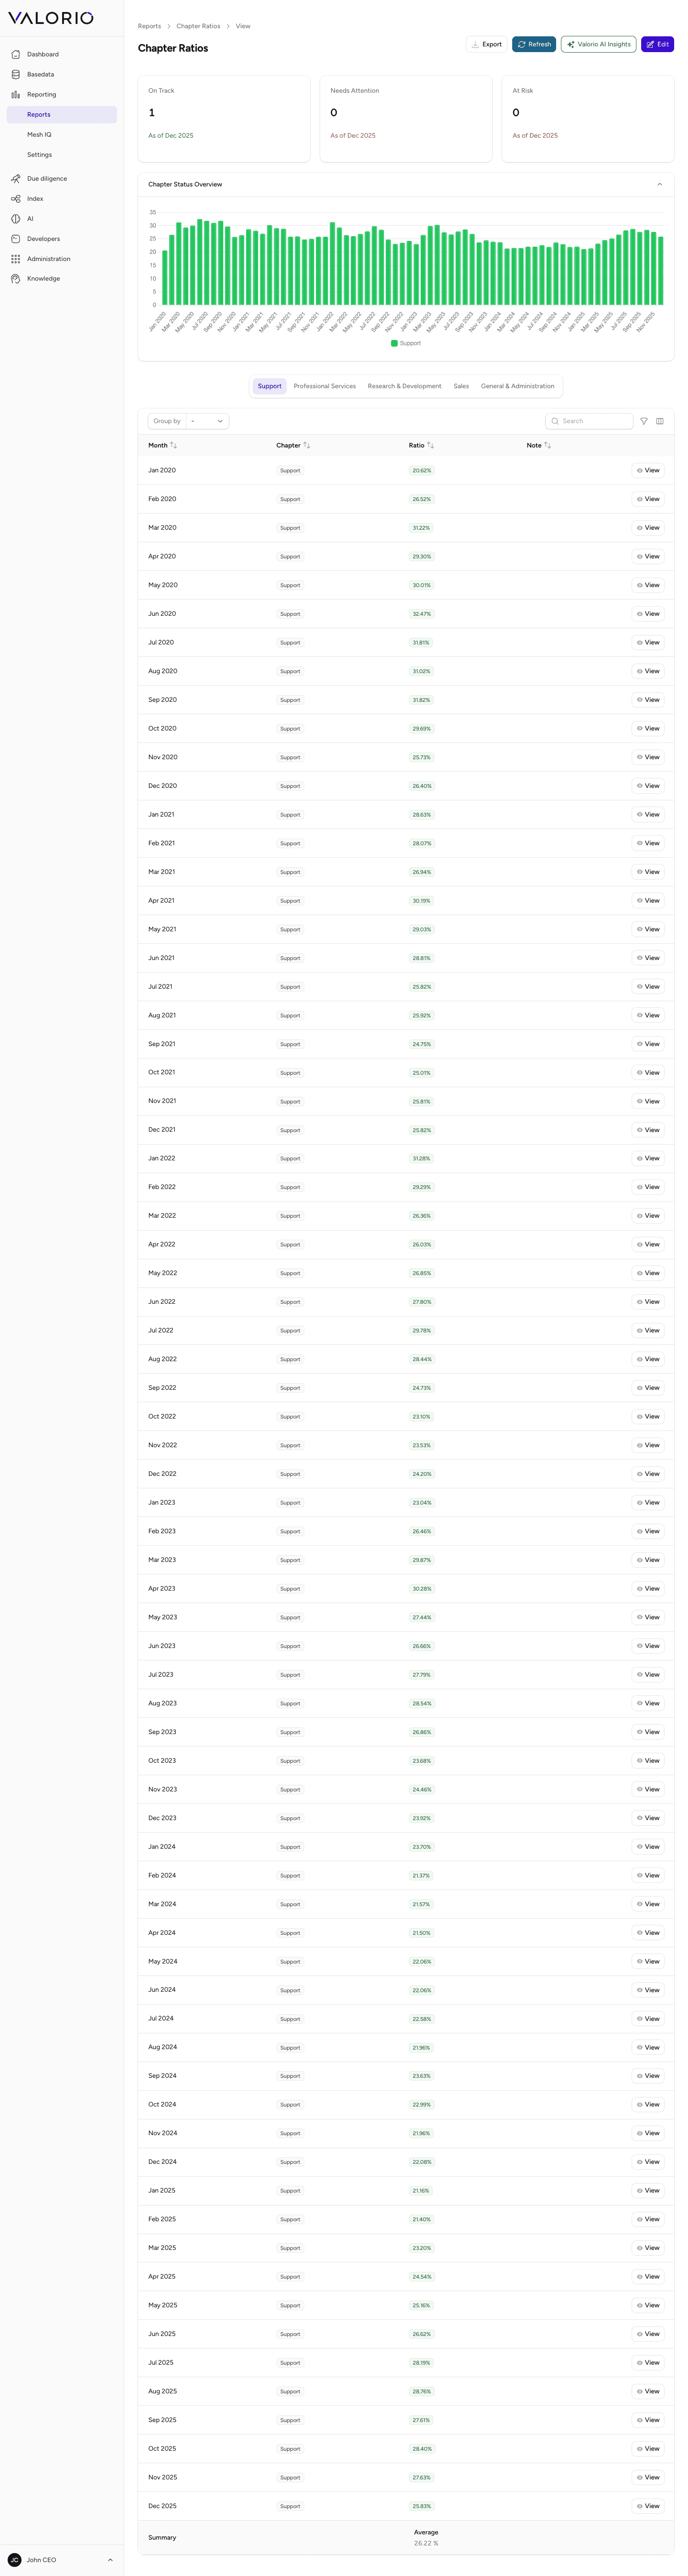
Chapter ratios
Compare the performance of individual business areas and identify strengths and opportunities for improvement.
Each "chapter" — a business area, cohort, or line of business defined for the workspace — gets its own color-coded read (on track, needs attention, at risk), so a reviewer can see at a glance which parts of the business are carrying the deal and which aren't.
Scheduled reports
Rather than generating a report on demand every time, a scheduled report runs on a recurring cadence and keeps a history of past runs — useful for a monthly board pack or a recurring buyer deliverable that needs to show trend over time, not just a single snapshot.
Report settings
Report settings control workspace-wide reporting behavior — currency and locale formatting, which metrics are enabled, and how scheduled reports are delivered.